Analyzing the Results
When the simulation is complete, you analyze the results. At the point probe, you compare the pressure and sound pressure levels with the provided data from the simulation without using the Sponge Layer model.
- Right-click the node and select Open.
- Add the data from the LES simulation without sponge layer to the Pressure Monitor Plot plot:
- Open the Pressure Monitor plot.
 The plots show that the pressure fluctuations are smaller when the spong layer is activated.
- Open the Pressure Monitor plot.
- Create a Fast Fourier Transform (FFT) for the sound pressure levels:
- Create a data set for the pressure fluctuations of the undamped LES simulation:
-
Create a monitor plot to compare the pressure fluctuation FFTs of the undamped
simulation with the damped simulation at the pressure probe:
-
Select the node and set Title to Sound Pressure Level
(dB).

For the analysis plot displaying the sound pressure level (dB) versus frequency (Hz) at the pressure probe, the level of noise is distinctly lower at lower frequencies when the Sponge Layer model is activated. The Sponge layer achieves non-reflective conditions at the pressure outlet boundary. Without the sponge layer, the sound pressure level (dB) is overpredicted.
-
Select the node and set Title to Sound Pressure Level
(dB).
- Open the Sponge Layer Damping Coefficient scene.

The functional shape of the damping coefficient allows for a smooth transition of the amount of damping in the sponge layer. From the simulation domain into the sponge layer, the damping coefficient increases until it reaches its maximum value and then decreases again. At the pressure outlet boundary, the damping coefficient has a value of zero to maintain the characteristics of the boundary condition.
- From your working directory, enter the image subdirectory where the images of the scalar pressure fluctuation scene are stored. To examine the scenes, click through the save image files or animate them with a media program of your choice. The following animation shows the pressure distribution over time:
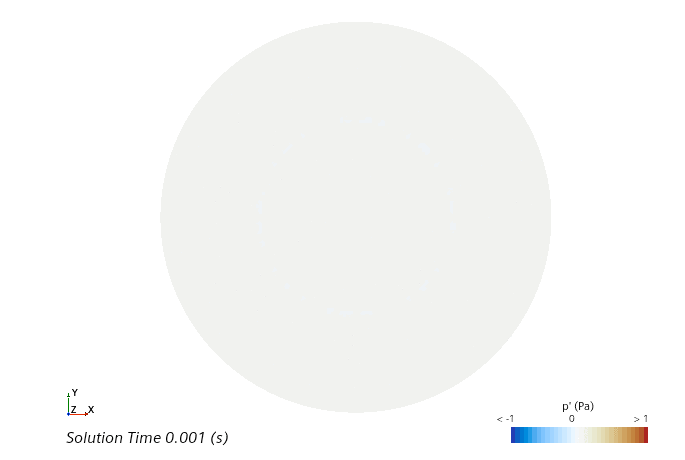
You can see that spurious pressure flucuations are gradually suppressed within the sponge layer. The Sponge Layer model damps the fluctuations towards a reference solution that is based on a moving time-average. The unsteadiness of the flow reaching the outer boundary is reduced, thus minimizing any unsteady wave reflection back into the computational domain.