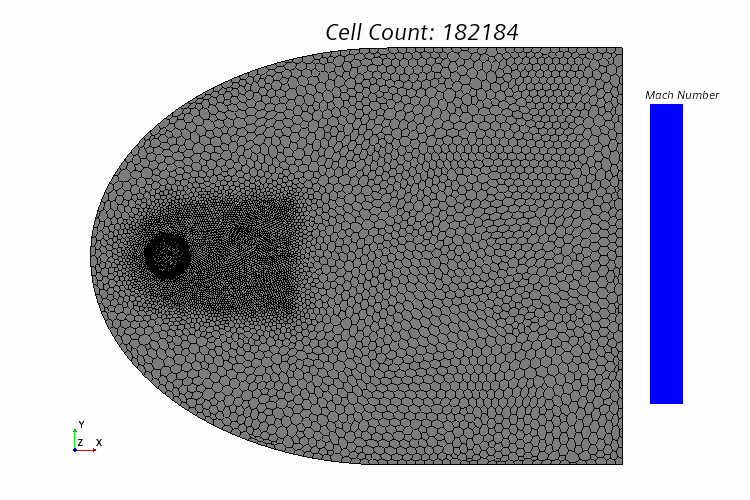
To visualize the shock wave in the hypersonic flow, you create a scalar
scene across the region that plots Mach number. As an indicator of mesh adaption you add a
cell count annotation within the scalar scene.
-
To create a cell count report:
-
Right-click the Reports node and select .
-
Rename the Element Count 1 node to
Cell Count.
-
Select the Cell Count node and set
Parts to .
-
To create a drag force report:
-
Right-click the Reports node and select .
-
Rename the Force 1 node to Drag
Force.
-
Select the Drag Force node and set the
properties as follows:
| Property |
Setting |
| Direction |
[1.0, 0.0,
0.0] |
| Parts |
SphereFlow:sphere |
-
To create a plot including Cell Count and
Drag Force reports:
-
Multi-select the node and node.
-
Right-click on any of them and select Create
Monitor and Plot from Report.
-
In the appeared Create Plot from Reports dialog,
select Single Plot.
-
To demonstrate the curves of both reports in one plot effectively,
right-click and select .
-
Select the Axes node and set the properties as
follows:
| Node |
Property |
Setting |
| Left
Axis |
Minimum |
1.5E7 |
| Maximum |
1.7E7 |
| Right
Axis |
Minimum |
0.0 |
| Maximum |
1E6 |
-
To select the Right Axis for report
Cell Count, select the node and set Y-Axis
to Right Axis.
-
To create a plane section parallel to the Y axis:
-
Right-click the Scenes node and select .
-
Switch to the Scene/Plot panel, right-click the Scene
1 node and select .
-
Rename the Scene 1 scene to
MachNumber.
-
Select the node and set the properties as follows:
| Node |
Property |
Setting |
| Scalar 1 |
Display
Mesh |
✓ |
 Parts Parts |
Parts |
SphereFlow:free stream,
SphereFlow:sphere,SphereFlow:sym |
 Scalar
Field Scalar
Field |
Function |
|
| Auto
Range |
Off |
| Clip |
Off |
| Min |
0.0 |
| Max |
12.0 |
-
In the Vis toolbar,
select the Save-Restore-Select Views and set .
-
To create an annotation from the cell count report, right-click the node and select Create
Text Annotation from Report.
-
Select the node and add it to the opened scene through drag and
drop.
The created plot is shown below:
-
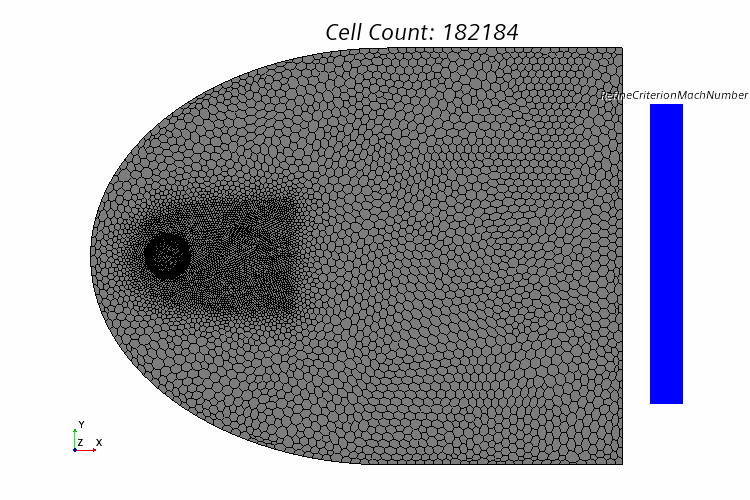
To observe the cell refinement status, you create a scene showing the adaption
criterion function RefineCriteronMachNumber:
-
Right-click the node and select Copy.
-
Right-click the Scenes node and select
Paste.
-
Rename the Copy of MachNumber scene to
RefinementFunction.
-
Select the RefinementFunction node and set the
properties as follows:
| Node |
Property |
Setting |
| Scalar
1 |
Display Mesh |
✓ |
 Parts Parts |
Parts |
SphereFlow:free stream,
SphereFlow:sphere,SphereFlow:sym |
 Scalar
Field Scalar
Field |
Function |
RefineCriterionMachNumber |
| Auto
Range |
Off |
| Clip |
Off |
| Min |
0.5 |
| Max |
1.0 |
| Color Bar |
Number of
Labels |
6 |
The created plot is shown below:


