Mesh: Checking the Mesh Quality
Use the field function and tools available in Simcenter STAR-CCM+ to check the quality of the generated mesh.
The volume mesh generated in the previous tutorial appears fine at first glance, however, to check the mesh quality properly, use the tools available in Simcenter STAR-CCM+.
To check the quality of the mesh:
-
Launch
Simcenter STAR-CCM+ and load
foundationTutorial_8.sim.
You can either use the sim file that you saved from the previous tutorial, or load the sim file provided in the tutorials bundle. See Downloading the Tutorial Files from the Support Center Portal.
- Save the simulation as foundationTutorial_9.sim.
-
Run the included Java macro to check the quality of the mesh:
-
In the
Macro toolbar, click
 (Play Macro).
- In the Open dialog, navigate to [INSTALL_DIR]/doc/startutorialsdata/foundationTutorials/data, select checkMeshQuality.java and click Open.
The macro sets up mesh quality plots. The cell quality, cell skewness angle, and volume change are displayed in histogram plots. The plots are opened automatically after running the macro. The macro also sets up derived parts and scenes to help you visualize the mesh and the mesh quality inside the scenes. -
In the
Macro toolbar, click
-
View the histogram plots:
-
Select the
Cell Quality Histogram tab in the window.
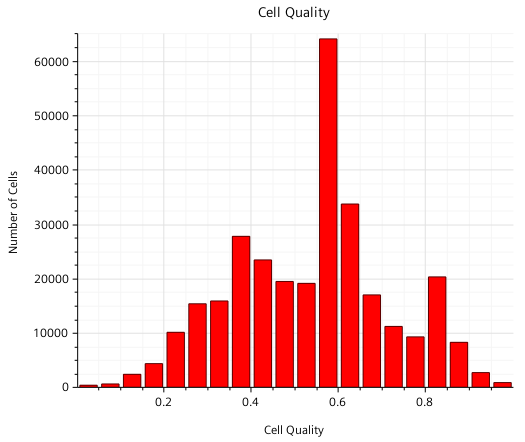
The shape of the cell affects the cell quality. Typically, uniform cells that have an even distance between the cell edge and the cell center are considered good quality cells. Squashed and uneven cells are considered poor quality cells. A perfect cell has a cell quality of 1.0. Cells with a quality less than 1.0e-5 are considered bad. You should aim for cells with a quality of 0.5 or greater.
-
Select the
Skewness Histogram tab in the window.
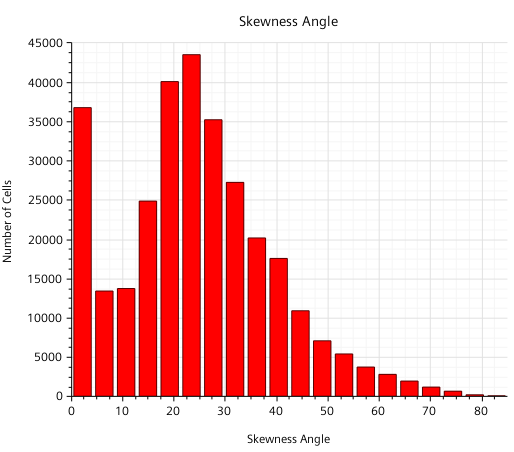
The skewness angle measures the angle between a face normal and the vector that connects two neighboring cell centroids. This measure is designed to show whether the cells on either side of a face are formed in such a way as to permit diffusion of quantities without these quantities becoming unbounded. A skewness angle of 0° indicates a perfectly orthogonal mesh. Cells with a skewness angle greater than 85° are considered bad. Skewness angles of 90 or greater typically result in convergence issues.
-
Select the
Volume Change Histogram tab in the window.
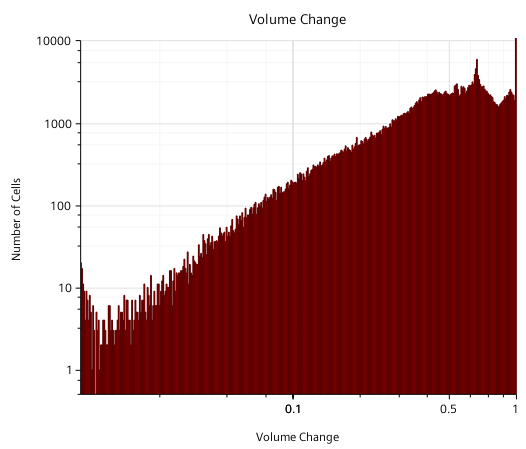
The volume change metric describes the ratio of the volume of a cell to that of its largest neighbor. A value of 1.0 indicates that the cell has a volume equal to or higher than its neighbors. Cells with a volume change of 0.01 or lower are considered bad cells. A large jump in volume from one cell to another can cause inaccuracies and instability in the solvers. From the histogram, you can see that there are some bad cells in the mesh.
-
Select the
Cell Quality Histogram tab in the window.
-
View the mesh quality scenes:
-
Select the
Mesh View: XY tab in the window.
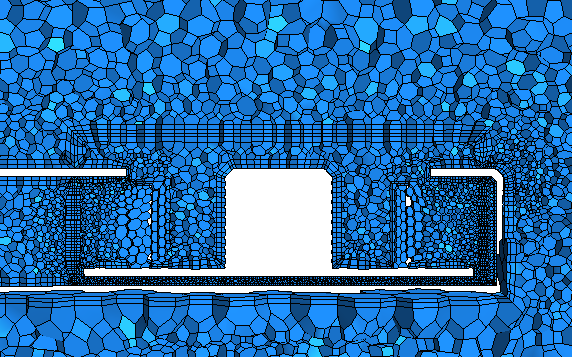
This scene shows a slice through the center of the simulation domain and displays the volume mesh in and around the rotating region. Upon closer inspection, you notice that the prism layer is generated on the interface between the two regions in the simulation domain. Prism layers are not required at this location. Another issue you can notice is that the prism layer is collapsed in the small gap between the fan and the card enclosure.
-
Select the
Mesh View: XZ tab in the window.

This scene shows a different view of the volume mesh inside the card. In this scene, you can see that the prism layer around the fan blades are too thick to capture the velocity gradient effectively, and the prism layer cells start to collapse near the tip of the blades.
In general, the quality of the mesh inside the rotating region needs refinement to help achieve a more accurate solution. Prism layers are generated on the interface between the static region and rotating region, when they are not needed. The prism layer is not generated on the bottom surface underneath the fan. It is important to have prism layers in this area. The prism layers around the fan blades are too large to resolve the velocity gradient accurately. -
Select the
Mesh View: XY tab in the window.
- Save the simulation.