Visualizing the Results
Visualize the scenes and plots that are relevant to this mechanical co-simulation analysis.


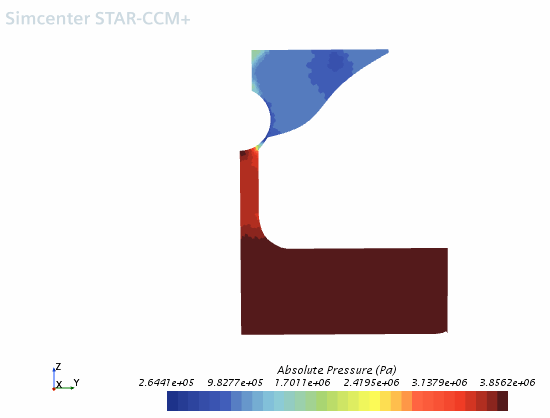
Visualize the scalar scenes displaying the pressure in the fluid domain and the pressure exported to the ball valve surface.
-
Open the
Absolute Pressure and
Exported Pressure scenes.
The Absolute Pressure scene appears as shown below.
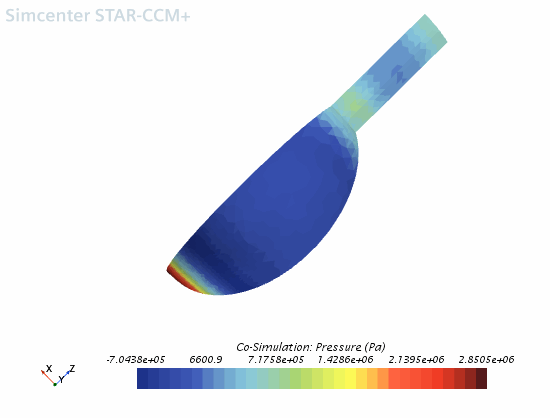
Visualize the exported pressure data on the ball valve surface, that is imported under the
Regions node when you run the co-simulation.
- Edit the node.
-
In the
Parts dialog, remove the selected boundary, select the
node then click
OK.
The Exported Pressure scene appears as shown below.
- Save the simulation.