Calculating the Line Spatial Fourier Transform
Use the values in this range to create a line spatial Fourier transform. The velocity of propagation is calculated from this transform.
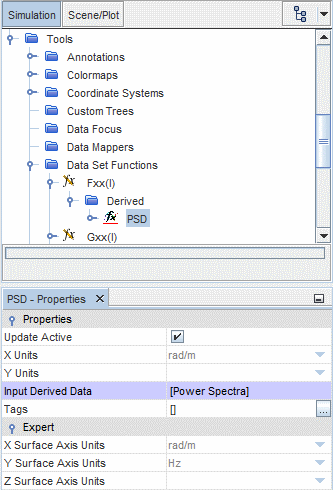
- Right-click the node and select .
- Rename the newly created node to Fxx(l).
- Select the node and set Start Signal to 0.0 m.
-
Set
End Signal to
0.2 m.

- Right-click and select New derived data from derived data.
- Rename the newly created node to PSD.
- Select and set Input Derived Data to .
-
Activate
Update Active.

With the Update Active property activated, the line spatial Fourier transform is automatically calculated. This process takes a few minutes, depending on the processor speed of your computer.
When the Fourier transform has been computed, visualize the spectra:
- Select and activate Log data.
Create a new scalar scene and rename it to
PSD.
- Select and deactivate Outline.
- Select and select Derived Data > PSD.
- Click OK.
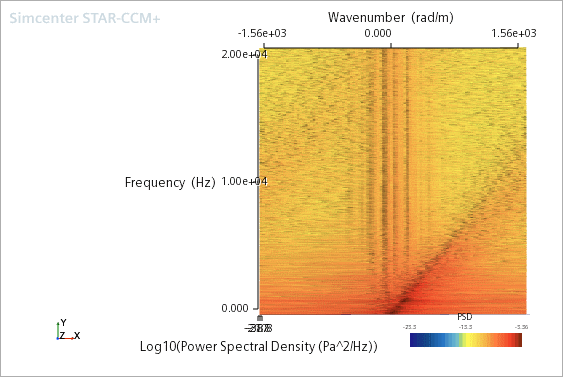
The power spectral density plot appears in the
Graphics window. Use the mouse to adjust the view.
- To color the plot, select and set Function to .
-
To visualize the Power Spectral Density as a two-dimensional contour, click
 (Save-Restore-Select views) in the toolbar and select
.
-
To align with the X-Y plane, press the
<T> key.

The slope of the distinctive line in the wavenumber-frequency plot is used to calculate the group velocity of the disturbances traveling along the domain. For this case, the group velocity is estimated as
m/s = 40.3 m/s
which is, as expected, roughly 80% of the inlet velocity.