Study Outputs
For each design simulation in a design study, Design Manager allows you to record and write specific outputs.
The outputs of a design study refer to simulation objects that are defined in the reference simulation. In Design Manager, you can define the following output objects:
Additionally, after each design simulation completes, Design Manager gives each associated design a Performance Rating.
Responses
Responses provide summaries of solution data—such as pressure drop or drag coefficient—and are based on Reports that you define in the reference simulation. For each design in a design study, Design Manager records the values of the specified reports at the end of the design simulation. Each design study in Design Manager requires at least one response.
Responses serve three main purposes in a design study:
- Information Only
- For each design simulation, responses record simulation results. The recorded response values allow you to compare designs with each other.
- Objectives
- Objectives represent the engineering goals of the analysis. For example, a report that records the pressure drop can be used by Design Manager to explore different designs aimed to maximize or minimize its value.
- Constraints
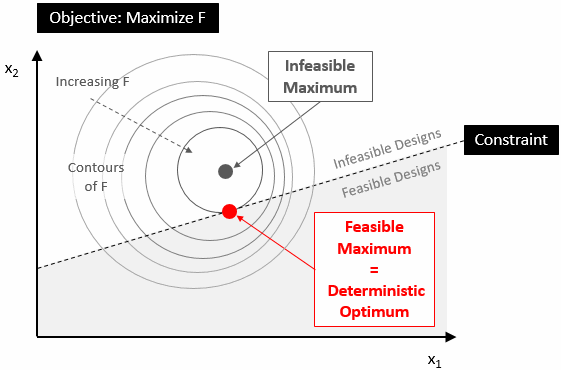
- Constraints limit the range of acceptable designs by setting limits on the design space. For example, you can set an upper limit for a report that records the mass of your engineering product. Designs that satisfy all constraints are called feasible. If any constraint is not satisfied, the design is called infeasible.
| Note | While a study is running, no change of responses on the fly is considered by Design Manager. The design study must be stopped and resumed to get the updated values. If the constraint values are updated after running the design studies, select node to update the output table. |
The following diagram displays how constraints limit the design space and affect the optimum design:

Scenes and Plots
Scenes and plots are based on Scenes and Plots from the reference simulation. At the end of each design simulation, Design Manager writes the respective scenes and plots to files.
The following file formats are supported:
- *.sce (Simcenter STAR-CCM+ Viewer Viewer file)
- *.png (Portable Network Graphics file)
PNG files are two-dimensional representations of the scenes and plots, whereas Simcenter STAR-CCM+ Viewer Viewer files allow you to interact with the exported scenes and plots as you would with the respective scenes or plots in Simcenter STAR-CCM+.
Performance Rating
In Design Manager, the performance of a design is based on the value returned for the objectives together with the degree to which a design satisfies its constraints. A high-performance design is one that satisfies all constraints and has a good rating on its objectives.
All designs that satisfy the constraints ignore the margin by which they meet those constraints. Once the constraints are satisfied, only the objectives contribute numerically to the performance evaluation. The performance value of each design is calculated using the following equation:
where:
- is the number of objectives in the design study.
- is the linear weight that you specify for the i-th objective.
- is the sign for the i-th objective. The value is -1 for objectives being minimized and +1 for objectives being maximized.
- is the response value for the i-th objective for that design.
- is the normalization value that you specify for the i-th objective.
- is the number of constraints in the design study.
- is the quadratic weight for the j-th constraint. This value is 10000.0.
- is the amount by which the j-th constraint is violated. is 0.0 if the constraint is met.
- is the normalization value for the j-th constraint, which is the value of the constraint itself. If the constraint value is 0, then the normalization value is 1.