Plots
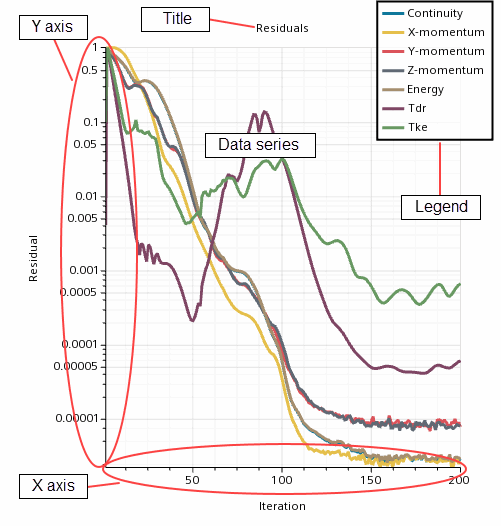
The plotting features in Simcenter STAR-CCM+ allow you to create three kinds of two-dimensional plots.

These plots are:
- Monitor plots that can display data from monitors, data set functions and/or tables.
Simcenter STAR-CCM+ uses two varieties of monitor plots:
- Monitor plots are user-created plots.
- The residual plot is generated and modified automatically by the system.
- Histogram plots that display solution data from the simulation and/or tables
- XY plots that display solution data from the simulation and/or tables
Plots can be created and modified in real time. The displays reflect changes to properties immediately, or if the simulation is running, between iterations. You can also customize how an XY plot or histogram plot is updated as the simulation iterates. You can create a plot before, during, or after you run a simulation. If you create the plot while the simulation is running, the plot is created between iterations.
You can define up to 4 axes in an XY Plot. The independent variable (X Type) is assigned to one; dependent variables (Y Types) can be assigned to one of the other three.

The data being plotted can be viewed in a spreadsheet-like dialog or it can be exported to file for manipulation in other programs. The plot can also be printed to file or to a printer.
You can also copy the plot’s information separately between simulation files, provided the destination simulation has the same dependent objects.
Deleting a plot does not delete the underlying objects that are associated with the datasets of the plot. For instance, a monitor plot deletion will not impact the underlying monitor, which will continue to collect data. The residual plot, which is created automatically, cannot be deleted.
Setting Preferred Attributes for Plots
You can create a preferred set of attributes for the plots in a simulation and apply them easily.
- To create a preferred set of plot attributes:
- From the menu bar, select .
- In the Options dialog, select the node.
- In the Properties window, specify attributes such as title fonts and plot line thickness.
- To apply your preferred attributes to a plot, right-click either on the plot node or in the plot display and select .
- To apply the attributes to multiple plots at once, multi-select the plot nodes, right-click, and select .
- To have a plot show more recent changes in plotting properties in the
Options dialog, use the
action again.
Note Simcenter STAR-CCM+ retains the attributes that you specify in the Options dialog, even in subsequent simulations. However, plots -- whether they are created before or after you set the attributes -- do not show those attributes until you apply them with the right-click action.