Signal Processing
Signal processing applies data set functions to sets of wave data.
There are two kinds of data set functions:
- Histories, which collect data at specified locations that are organized into points, lines, or surfaces.
- Transforms, which are either Fourier transforms or inverse Fourier transforms. Fourier transforms derive frequency data from signal data. Inverse Fourier transforms derive signal data from frequency data.
Data set functions depend on derived data sets, which you specify for each function. Derived data, in turn, depends on input data from the simulation.
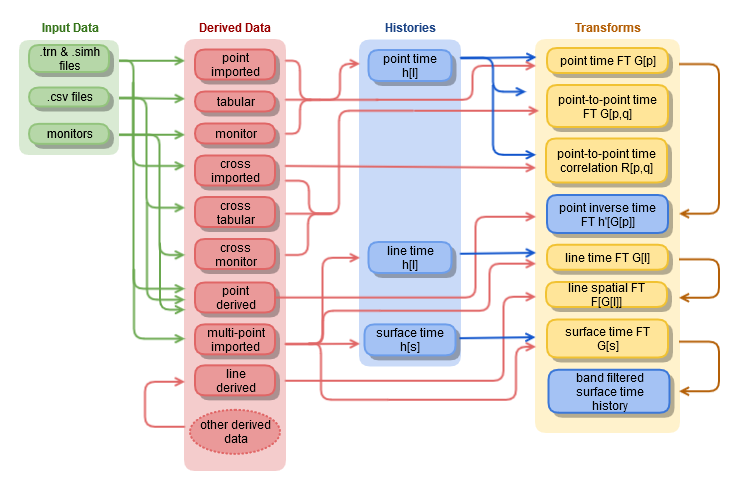
In general, the flow of information is:
- Input data from the simulation is organized into derived data sets. Different forms of data sets use different types of input data.
- Derived data sets supply information to data set functions - histories and transforms. Different functions take information from different data sets.
- Histories supply information to transforms. Different transforms use information from different types of histories.
- Some transforms supply information to others, the inverse transforms, some of which are reconstructed histories.
The details of information flow are shown in the following chart:
For signal processing in particular, any signal can be represented either in the time or the frequency domain.
These representations are equivalent, that is, . Fourier transforms are used to transform a signal from the time domain to the frequency domain, and inverse Fourier transforms are used to do the reverse. Transforming a signal to the frequency domain makes it possible to identify the dominant modes in the signal.
Signal processing functions can be used in two contexts in Simcenter STAR-CCM+:
- They can be applied to data stored in monitors, such as would be obtained from a report of a particular value at a point. The results of this analysis of data at a point can be visualized in monitor plots.
- They can be applied to data stored on selected surfaces at specified time intervals in the .trn file. The results of this analysis of data on a surface can be visualized in scenes.
One example of using data set functions for frequency analysis would be a study in which the goal was to reduce the noise that a room fan generates. The initial part of the study would involve a validation exercise, in which you would take experimental measurements of pressure against time at a location set some distance from the fan. These measurements would be used in a frequency analysis to identify the dominant modes for this signal and the frequency bands containing these modes. Large modes within the range of frequency audible to human hearing would suggest a noisy environment. Following the experimental analysis, a transient simulation would be run for the same configuration, with a monitor being set at the same location as the pressure probe used in the experiment. Frequency analysis would be applied to the monitored data to obtain the dominant modes predicted by the simulation. Comparing the predicted modes to the measured modes gives an understanding of the uncertainty that is associated with the simulation. If uncertainty is within acceptable levels, further simulations could be performed for varying configurations of the fan. These simulations would investigate ways of reducing the dominant modes, or at least moving them out of the range of human hearing.
This section explains the following: