Working with Histogram Plots
Histogram plots are two-dimensional bar charts that can be used to display data distribution.
The data population is divided into discrete categories, called “bins”. The frequency of occurrences in each bin is given on the vertical scale. The node has properties and a pop-up menu.
The Display Mode property provides three different options for presenting data in a histogram plot:
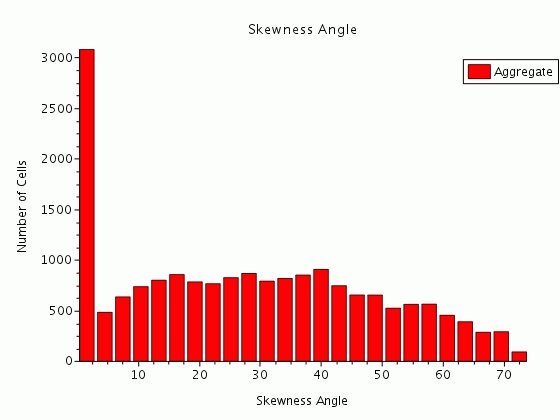
- Aggregate: All parts in the plot are treated as a combined single entity.
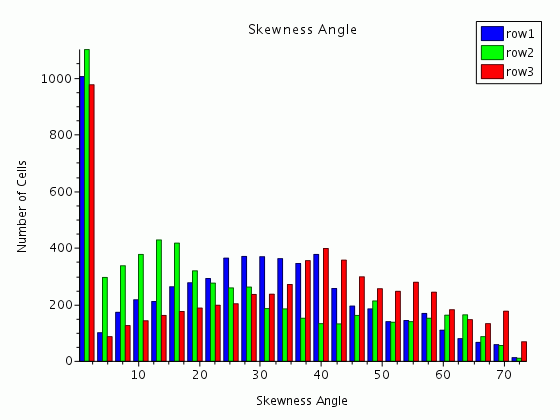
- Side-by-Side: Parts are separated as individual bars that are easier to compare, but are not as accurately aligned with the axis values underneath them.
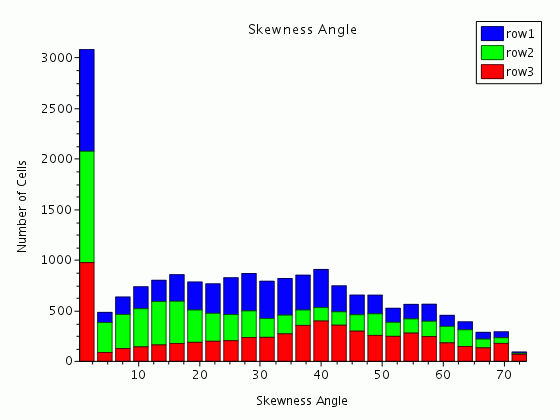
- Stacked: This option divides the bars into quantities for each part.
Creating a Histogram Plot
To create a new histogram plot, right-click on the node and select .
The histogram plot will initially be empty, so you will need to add data to be displayed by accessing the plot node’s Parts property.
Setting up a Histogram
To specify the details of how your data is to be displayed, use the contents of the node:
- Set the number of intervals along the x-axis (binning axis) in the Bins property of the Axis Type node.
- Specify the field function in the Field Function property of the node.
- To set the range:
- Set the Range Mode property of the Axis Type node to Manual.
- Select the node and set the minimum and maximum values in the Range property.
- To customize the y-axis (weighting axis) with a scalar function:
- Set the Weighting property of the Axis Type node to Scalar Function.
- Select the node and make a selection in the Field Function property.
- To control whether the bins are scaled logarithmically or not, use the Bin Spacing property. For details about the options of this property, see "Bin Spacing" in Axis Type Properties.
You can also use the drag-and-drop technique to change the scalar function of either axis:
- Expand the node.
- Drag the field function node of your choice onto one of the axes, around which a highlight box appears as you hover over it with the mouse pointer. Dragging onto the x-axis changes the binning function and dragging onto the y-axis changes the weighting function.