Updating Plots
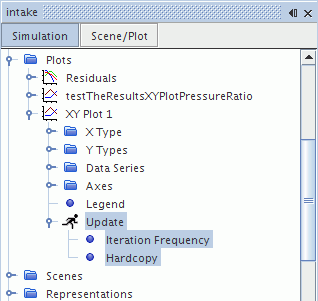
You can control how open XY, monitor, and histogram plots update by changing the trigger type that is located in the node.

- A trigger node to control the frequency of updates. The name of this node reflects the choice of trigger type. See Trigger Types and Trigger Properties.
- A Hardcopy node to control the specifications of the images that are generated by the plot updates. See Update and Hardcopy Properties.
For more information on selecting the trigger type and defining the update frequency, refer to Setting the Trigger for an Update.
| Note | Although updates occur at specified iterations, time-steps or delta times, these specified updates do not necessarily block all other updates that can occur due to user interaction. |
Updating a Plot Manually
The plot may also be refreshed manually. A plot is updated when you open it or switch to its tab.
Alternatively, expand the node and right-click on the chosen plot. Choose from the pop-up menu.
Generating Images from a Plot
You can also generate an image of the plot after each iteration or time-step to compile an animation of the plot. This is different from the single image generated when you save a hardcopy of the plot.
If all clients are disconnected from a running server, no plots will be saved to files.
Note:
- The update mechanism is only active whilst the simulation is iterating.
- Multiple Y types within a XY plot displaying different scalar quantities will update simultaneously whenever an setting triggers an update. For example, the scalar quantities displayed in a Y types are updated to represent the new solution. Closed XY plots are not updated until they are opened.
- Hardcopies will only be written to disk at the intervals dictated by the setting for a particular plot.