Plotting with Multiple Axes
Simcenter STAR-CCM+ lets you add an axis to a plot to allow the comparison of multiple variables in a single chart display.
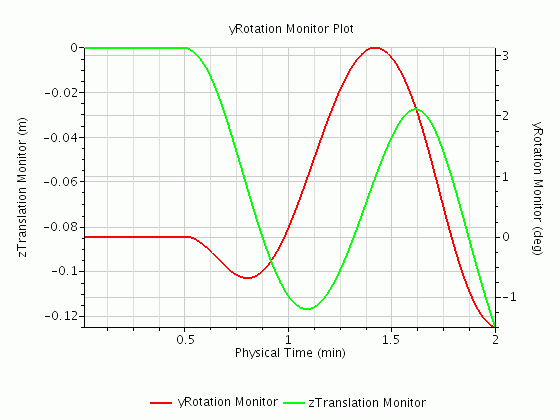
With multiple axes, you can compare correlations within Simcenter STAR-CCM+. For example, you can view horsepower against RPM and torque against RPM on the same plot. Additionally, when you have quantities with widely different scales of values, such as meters and Pascals, it helps to plot them on separate axes to make the graphs readable.
To view two correlations in an XY plot:
- Create the XY plot and select the parts from which to plot data.
- Select the quantities for the axes that are present by default, at bottom and at left.
- Right-click the Axes node and select .
- To create a second Y Type node, right-click the Y Types node and select New.
- Select the new Y Type node and set Y-Axis to Right Axis.
- Select the quantity for the Y Type node that you have mapped to the right axis.
- To change the orientation of the axes, right-click the Axes node and select Orient Axes. Use the buttons in the dialog to set the orientation.
-
Customize the data points, ranges, and grid lines as you see fit.

To use multiple axes with tabular data sets:
- Add a table in the simulation. See Tables.
- Add the table as a data set to the plot. See Managing Data in a Plot.
- To display the tabular data on the axes of your choice, use the X-Axis and Y-Axis properties of the data set node.
To view multiple monitors, with widely differing ranges, in a single monitor plot:
- Create the monitor plot -- either an empty one, or one from a report or a monitor.
- Once the first quantity is plotted, right-click the Axes node and select .
- Create the second monitor.
- Add the second monitor to the plot. See Managing Data in a Plot.
-
Select the newly added monitor data set node and set
Y-Axis to
Right Axis.
You now have a single plot of the values from two separate monitors.