Interacting with the Plot Display
The plot display in Simcenter STAR-CCM+ allows you to adjust the axis ranges interactively, zoom into an area, and pan the plot area. You can also reset to the original plot view.
Adjusting the Axis Ranges Using Handles
As you hover with your mouse pointer over the ends of the plot axes, axis handles appear as shown below. When you hover the mouse pointer over the handle line, arrows show you which direction to move.
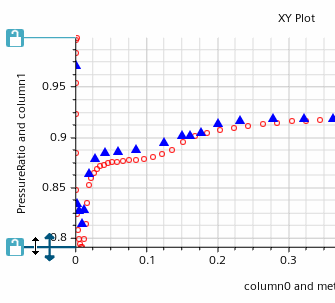
To change the bounds of the axis, click and drag the line.
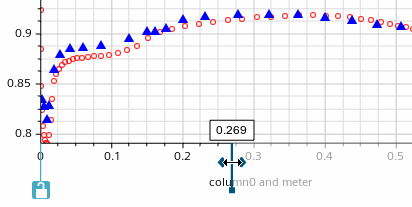
The plot display adjusts to the new bounds.
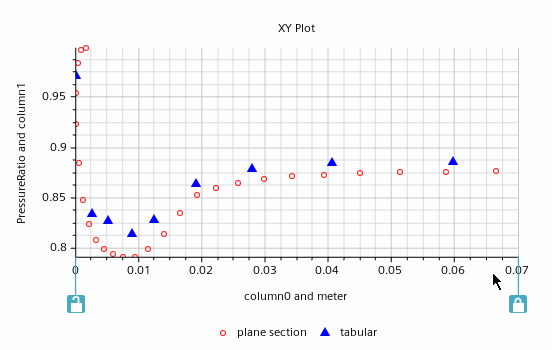
The corresponding axis property, such as Maximum, is changed in the Properties window accordingly. The new bound is locked in place by default (as shown by the closed lock icon). To adjust a particular bound, you can unlock that bound by clicking its lock icon. The closed and open lock icons are the equivalent of activating and deactivating the Lock Minimum and Lock Maximum properties, while the handles are equivalent to numerical entries in the Minimum and Maximum properties.
To restore the original view of the plot, click the  (Fit Plot View) button in the toolbar, or press
 <R>.
Zooming and Panning
To zoom in on the plot display and pan:
- Press the middle mouse button (or mouse wheel) while pointing in the plot display. This action activates the plot zooming feature, which operates on the rubber-banding principle. With the middle mouse button pressed, drag the mouse through the area of the plot that you want to magnify. This will show a quadrangle expanding like a rubber band.
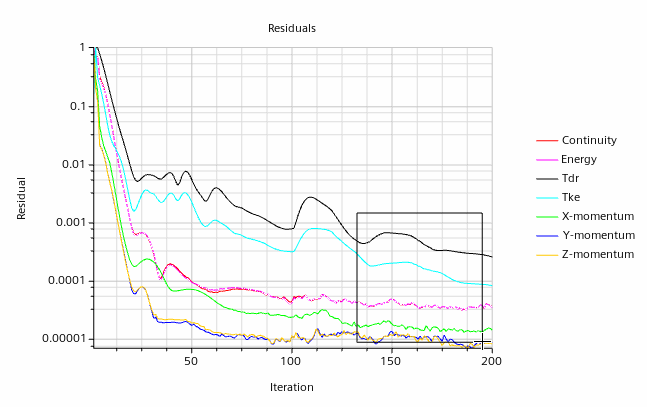 That quadrangle bounds the zoomed area.
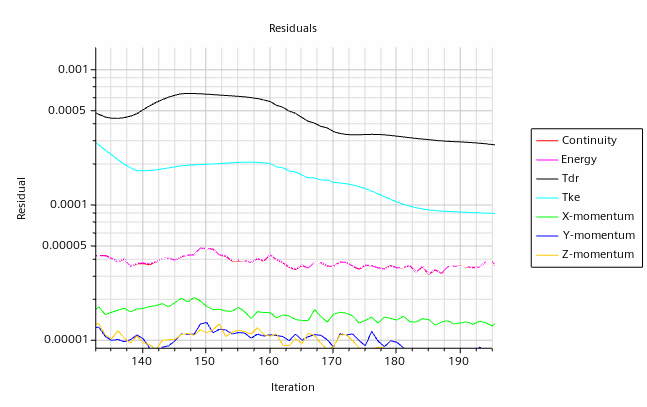
Alternatively, use the mouse wheel: turn it toward you to zoom in, or away from you to zoom out.
- When you are zoomed in on the plot, you can drag the mouse pointer to pan and examine adjacent portions.

To restore the original view of the plot, click the  (Fit Plot View) button in the toolbar, or press
 <R>.