Study Analysis
Design Manager provides post-processing capabilities by which you can analyze the outputs of a design study.
In Design Manager, you can create the following types of post-processing objects:
With these post-processing objects you can analyze the designs of a Design Set. A design set is a collection of designs that meet some specific criteria. Design Manager provides you with the following predefined design sets:
- All—all designs in the design study
- All Best—all best designs in the design study history (not available for Pareto Optimization study)
- Error—designs that failed
- Feasible —designs that meet all constraints in the design study (not available for DOE and CAD Robustness studies)
- Last Best—the best design in the design study history (not available for Pareto Optimization study)
- Successful—all designs apart from the Error designs
- User Design Set—all the designs filtered in the user-defined
design set (see User Design Set
)
Output Tables
Output tables display the designs within a design set and their details in tabular form. For each design, an output table lists the following items:- Design#—design number in the design exploration history
- Name—unique label for the design
- State—progress of the design simulation. Various icons appear that tell you which state the design simulation has reached. For a full list, see State.
- [Response]—recorded response from completed design
- Performance—performance value of the design
- [Parameter]—input parameter applied to the design
Using output tables, you can track which design simulations are queued to run, which have started to run and which are currently running. You can also see which design simulations are complete and, of these completed designs, which simulations completed successfully and which received an error.

Snapshots
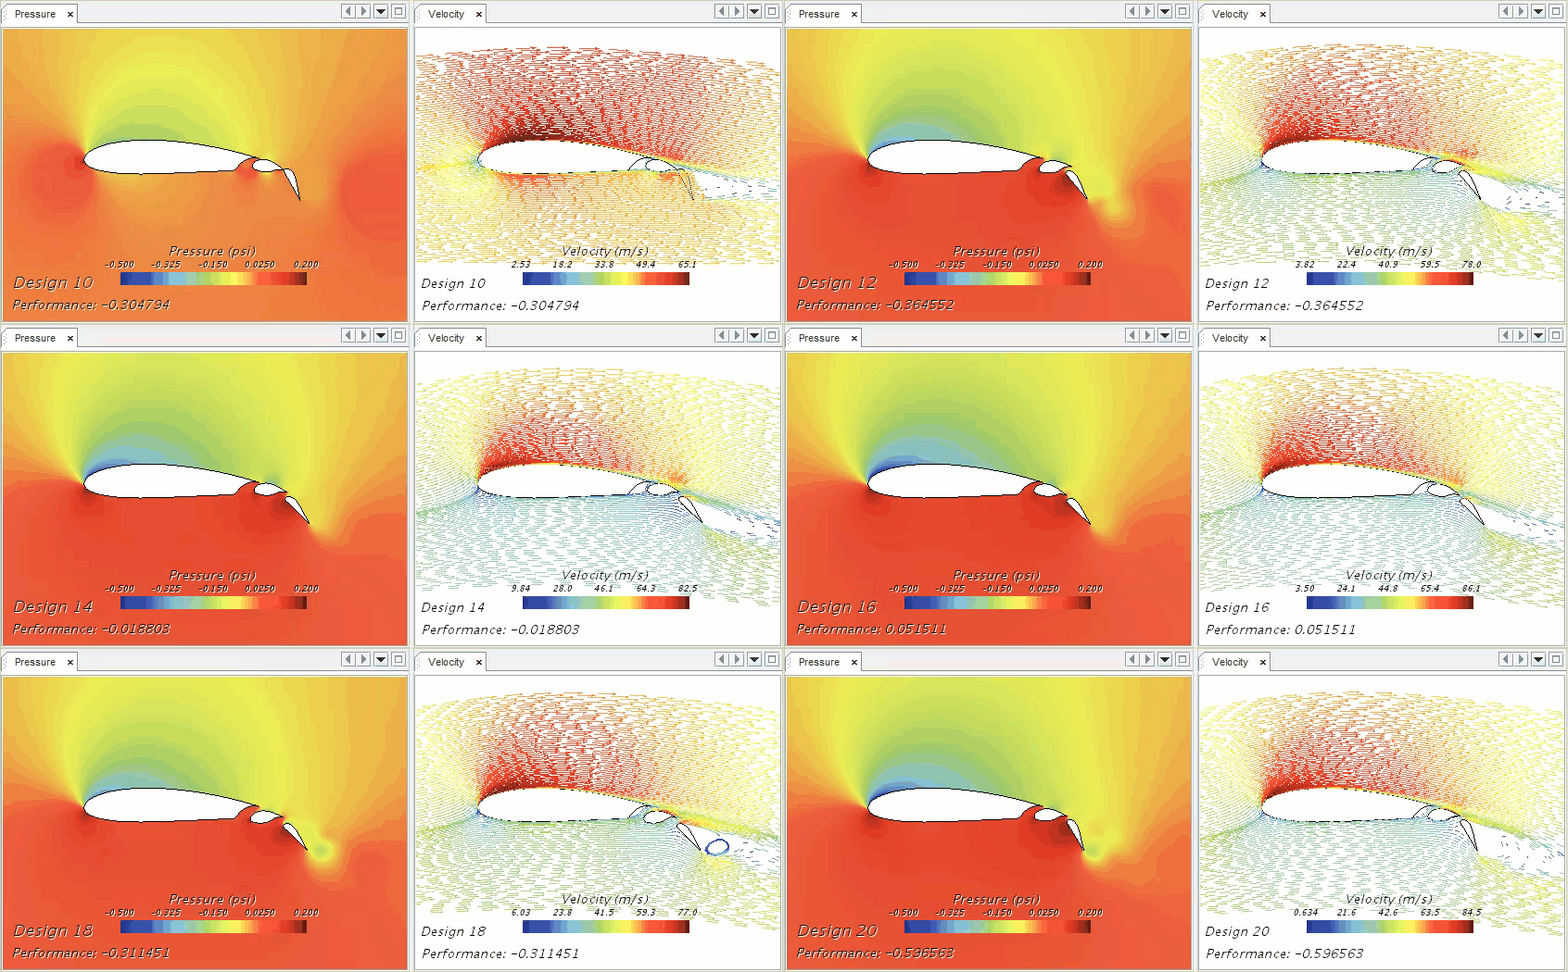
Snapshots allow you to view the scenes and plots that are exported from the design simulations of a design set.Each snapshot refers to a specific scene or plot where you can visualize the results of different designs. By default, all snapshots display the same design, which allows you to perform side-by-side comparisons of different scenes or plots.
| Note | Scenes and plots are not available when the Evaluation Method is set to Surrogate because no simulation runs in this design study. |

You can create multiple snapshots that display the same scene or plot. When you lock one of the snapshots to a specific design, you can compare results between different designs. You can link snapshots so that they move in tandem as you interact with one of them.
Design Plots
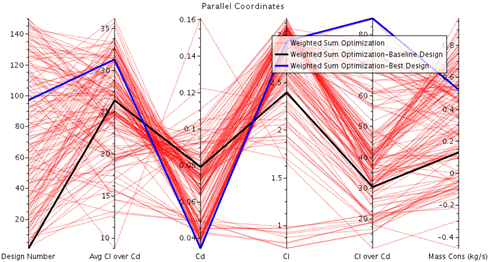
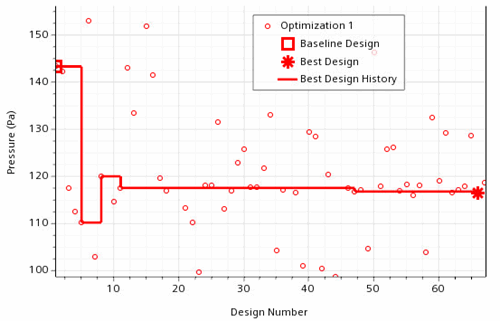
Project plots are two-dimensional graphs displaying results that span all the designs in a design set. With these graphs, you can display relationships design variables. You can either create a plot directly from a design study or from the Plots node of the design project. For more details, refer to Creating Design Plots.When creating a plot by right-clicking the Plots node, the plots are categorized into three types:
| Note | Output tables, snapshots, and design plots are linked to each other. When you select a certain design within one of these post-processing objects, the other objects are synchronized automatically to reflect the selected design. This feature enables you to flick through the designs of a design set. |


