Creating Design Plots
Design plots are two-dimensional graphs that allow you to display the relationship between variables from a design study.
You are advised to create plots directly from a design study.
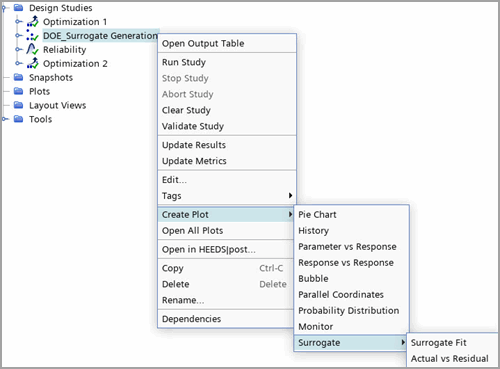
- Right-click and select Create Plot to choose one of the available plots for this design study.

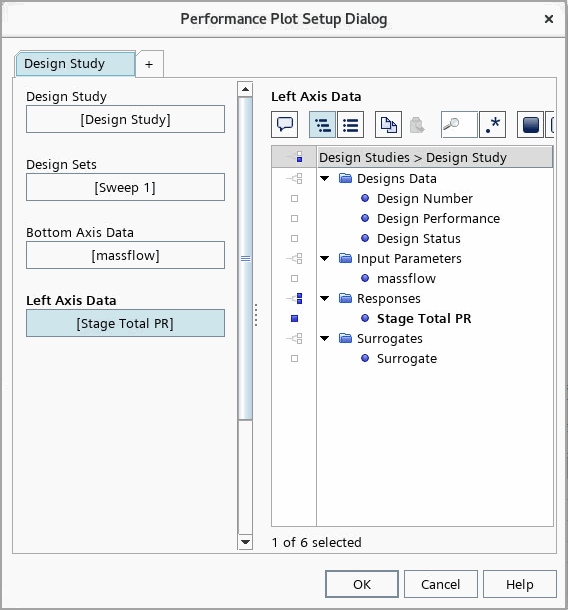
- Depending on the study type and plot type, a pre-populated plot setup dialog opens in which you select objects to plot.The example below is for a performance plot from a smart sweep study:

- Set the plotting properties within the Plot Setup Dialog. See: Plot Setup Dialog Reference.
- When creating a specific design plot from the Plots node of the design project, there are three categories of plot type: