Monitoring a Design Study
In the GUI, you can check the progress of a running design study in the progress and status bar beneath the explorer window. You can also view post-processing objects while a design study runs, allowing you to view progress interactively.
To track the status of all the design simulations of a design study in tabular form:
-
Select the
node and select
Open Output Table.
The output table opens in the Graphics window and displays all designs of the design study together with their respective input parameter and response values. The State of a design indicates the current stage of the design simulation. The Performance value of a design is a rating value that allows you to judge the design. For more detail, see Output Table Reference.
As soon as a design simulation completes successfully, that is when
State equals
 , you can view the exported scenes and plots of that particular design:
 , you can view the exported scenes and plots of that particular design:
 -
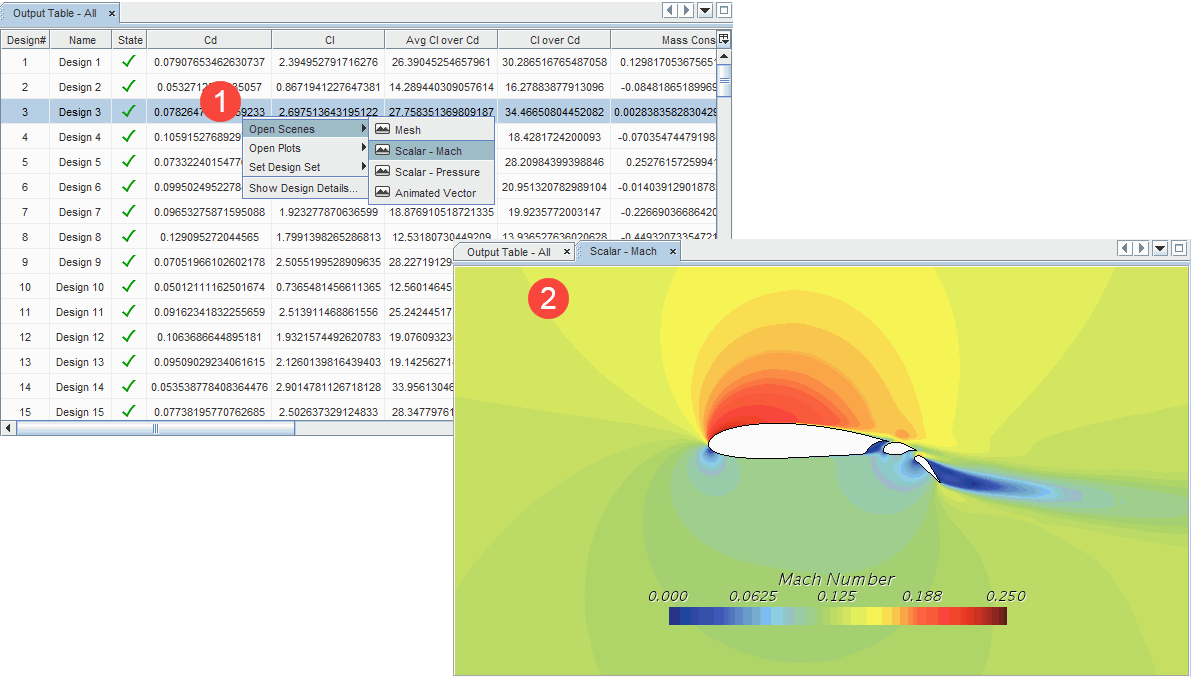
In the output table, right-click the design of interest and select
, where [scene] is the scene you want to visualize. For plots, you select
.
The scene or plot opens in the Graphics window.Once you open a scene or a plot, a snapshot is created automatically. See Snapshots Reference.

If you prepared project plots before the run, you can monitor the progress of the design study using these plots:
-
In the object tree, right-click the respective
node and select
Open.
The project plot opens in the Graphics window. Once a design simulation completes, a new data point appears in the plot.Design Manager automatically updates the marker of the best design and the path to the best design during the run. For more information, see Plots Reference.
For more detailed information, see Analyzing the Results of a Design Study.