A study runs significantly faster when you compute responses using surrogate
models instead of simulations. In Design Manager, a
typical application for surrogate models is a Robustness and Reliability study with
a large number of sample points in the design space.
Before applying surrogate models, you must
first generate suitable surrogates within a design study which covers the
part of the design space you are interest in, which can be a local space
around the best design or globally scattered samples.Once the surrogates
are generated, they can also be exported to other tools to replace
expensive simulations. For essential concepts of surrogates, refer
to Surrogate Models.
Surrogate computation
and cross validation require an innovatesuite
license. See also: Design Manager
Licensing.
In
Design Manager,
surrogates can be computed from any study type except CAD Robustness
study type. For most applications, you are advised to use
Adaptive Sampling and
Design of Experiments (DOE) with
Latin Hypercube Sampling method for surrogate generation.
Adaptive
Sampling automatically generates the best fit surrogate type
according to the Adaptive
Strategy you set. For a DOE
study, you specify surrogate settings
manually.
-
To generate surrogates with an Adaptive
Sampling study:
-
Create a design study.
-
Select the [design
study] node and set Study Type to
Adaptive
Sampling.
-
Select the Adaptive Sampling
Settings node and set adaptive
sampling properties.
-
Select the Input
Parameters node and add input
parameters to Parameters.
-
Select the Responses
node and add design responses.
A surrogate uses all the input
parameters specified in the design study and
provides approximation only for one response. The
number of responses you add here determines the
number of generated surrogates.
-
Run the Adaptive Sampling design study.
During the design study run, the
surrogates are automatically created based on the
Adaptive Sampling Settings
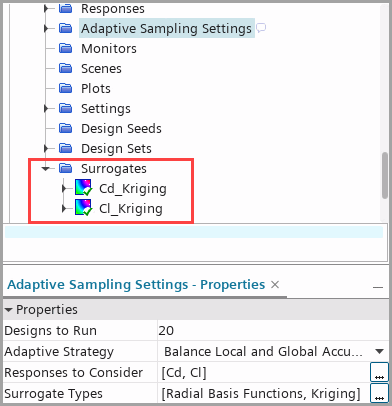
you specified before. An example is shown below:
You
obtain one surrogate for each response. The
adaptive sampling algorithm specified the
surrogate type Kriging out of the two
possible types.
-
To assess the prediction accuracy of the
computed surrogates, investigate relevent data set
and create plots as described in Assessing Surrogate Accuracy.
-
To generate the surrogates with a DOE
study:
-
Create a design study.
-
Select the [desisgn
study] node and set Study Type to
DOE.
-
Select the DOE Settings
node and set DOE
Type to Latin Hypercube
Sampling.
The LHS algorithm promotes an even
distribution of design points over the specified
design space. This approach improves the accuracy
of the computed surrogate approximation.
-
Select the Input
Parameters node and add input
parameters.
-
Select the Responses
node and add design responses.
-
Right-click the node and select New
Surrogate.
-
Select the Surrogates
node and keep the Auto Compute activated.
-
Select the node and set its properties. For
more details, refer to Surrogate Reference.
A surrogate uses all the input
parameters specified in the design study and
provides approximation only for one response. This
response you set in the
Response of the
[surrogate] node.
After setting up surrogates, you can open up the
Surrogate Table by
right-clicking Surrogates
node and selecting Edit Surrogate
to multi-editing the surrogate settings. See also:
Edit Surrogates.
Alternatively, you can also create a surrogate
for a certain response by right-clicking the node and selecting
Create
Surrogate.
-
Repeat the previous step for each response
which you wish to analyse.
-
Run the DOE design study.
The surrogates are automatically computed
during the design study run.
-
To assess the prediction accuracy of the
computed surrogates, investigate relevent data set
and create plots as described in Assessing Surrogate Accuracy.
After evaluating the simulation-based design study
in which the surrogates are created and computed, you either export
surrogates to other tools or run a surrogated-based design study in
Design Manager.
-
To export surrogates to other tools:
-
To export surrogates as Functional Mockup Units
(FMUs), refer to Exporting Surrogates to Excel using VB Files.
-
To export surrogates as Visual Basic for
Application Code Files (*.bas) in Excel,
refer to Exporting Surrogates to Excel using VB Files.
In
Design Manager, the most common
applications of surrogated-based design studies are
Robustness and Reliability studies
due to the large number of designs.
To reflect the distribution
of the responses, a Robustness and
Reliability study often requires
2000 designs. Surrogate
models are necessary to replace
simulations
-
To set up a Robustness and Reliability
study using surrogates:
-
Create a Robustness and
Reliability study.
-
Select the [robustness and
reliability study] node and set
the Evaluation
Method to Surrogates.
-
For input parameters, use values from the best
design as Baseline
Values and define their
Standard
Deviation (the default value is
10%). With those two
values, normal distributions of the input
parameters are defined. Statistical samples of the
input parameters are used in numerous design
studies.
-
Select the node and set Designs to Run to a
sufficiently large number, for example, 2000. The
number should be sufficient to cover the normal
distributions of the input parameters.
-
Select the node and specify Sampling
Method
You are advised to apply the
method Monte-Carlo if
Designs to
Run is set to a number over
10000.
-
Select the node and add the input parameters
used in the previous DOE
study.
-
Select the node and add the responses whose
surrogates are created in the previous
DOE study.
-
Run the Robustness and Reliability design
study.
-
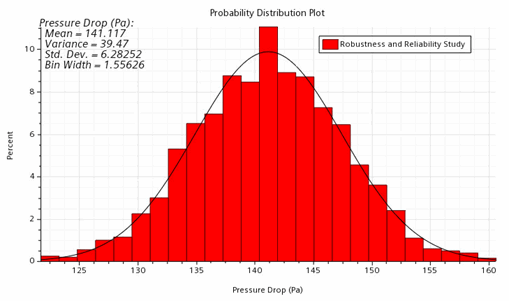
Right-click the node and select .
In the probability distribution plot, you can
compare the expected distribution of responses
against a normal distribution. If the bars fall
below the normal distribution of design responses,
the baseline values of the input parameters are
considered to be robust. Each response requires
one individual probability distribution plot.

