Creating Pie Charts
Design Manager provides you with a pie chart view of the design feasibility of a design study, both during and after the design study has run.
Design feasibility is the qualitative overview of how well the output of a design study fits with the constraints, responses, and bounding parameters that have been set during the study run. To create a pre-populated pie chart, you are advised to use the workflow Creating Design Plots.
- To create a Pie Chart plot where the design study is not yet selected:
- Right-click the Plots node and select .
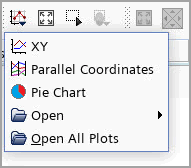
- You can also create a Pie Chart plot directly from the toolbar.

The Pie Chart Plot Setup dialog, in which you set the only property—Design Study. - Right-click the Plots node and select .
- Right-click the node and select Add Data.
- Select the required [design study] and press OK.
To create a default pie chart for an existing design study which has already run:
- Right-click and select .
- Set the properties for the pie chart plot. See Pie Charts Reference for more details.
 The pie chart depicts design feasibility according to the following outcomes:
- Running (light grey) — feasibility results are not available for design runs still in progress.
- Error (red) — designs have failed.
- Successful (green) — designs which are analyzed to a completed state without failing in any form.
- Feasible (green) — when constraints or bounding parameters are set up all designs which run successfully and fall within the specified tolerances set are designated as feasible
- Infeasible (yellow) — when constraints or bounding parameters are set up all designs which run successfully but fall outside of the tolerances are designated as infeasible