Analyzing the Results
At the end of the simulation, you analyze the shape and postion of the interface between the inner and the outer phase.
-
Select the Phase Field tab at the top of the
Graphics window. The following screenshot
shows the phase field at the end of the simulation:
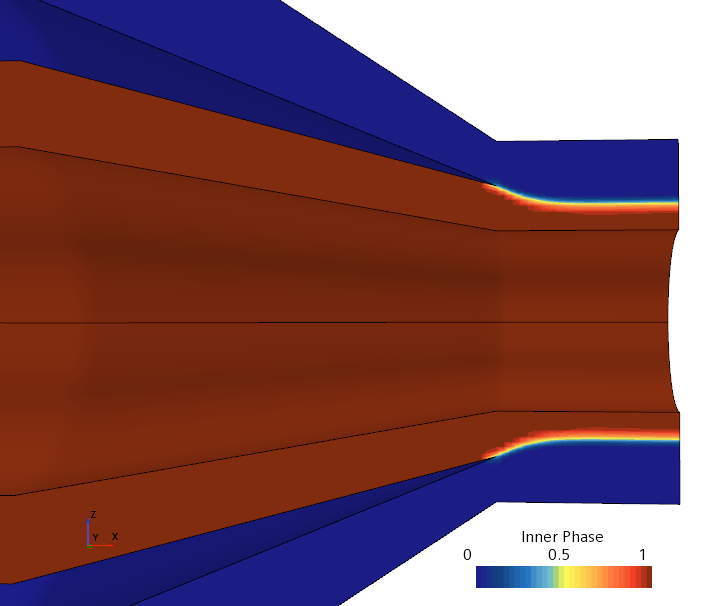
You can see how the inner and the outer phase meet at the die exit and form an interface. The interface is characterized by a phase field value of 0.5, that is, 50% of the cell is filled with the inner phase and 50% is filled with the outer phase.
The interface appears as a band where the inner phase field transitions between 0 and 1. The band is a result of numerical diffusion within the simulation. To keep this transition band as small as possible, that is, to achieve a sharp interface between the phases as is the case here, you are advised to refine the mesh in areas where you expect the interface to be.
-
To display an enhanced view of the interface shape and position, select the
Swelling tab.
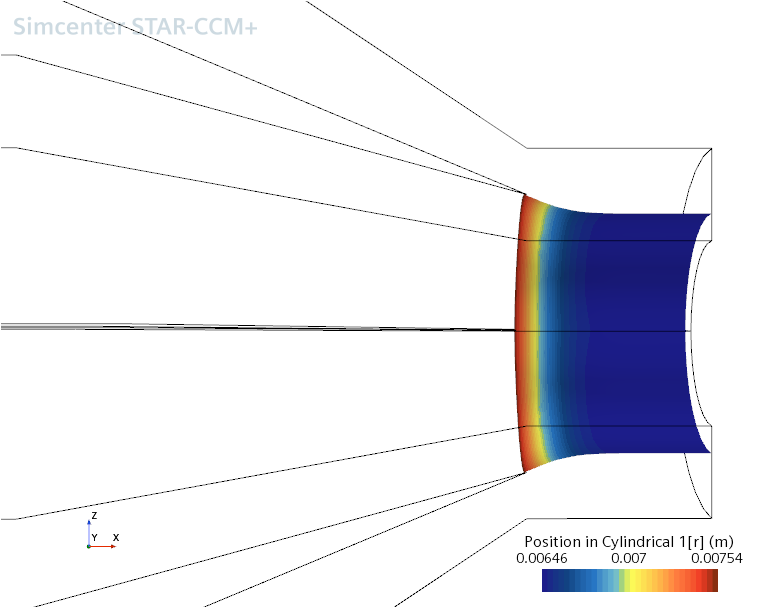
You can see that the outer phase swells initially when meeting with the inner phase, before the interface settles at a constant radius. From this, you can determine the resulting diameter of both the inner and outer phase.
Additionally, you can perform analyses by creating plots and scenes to visualize the material properties of each phase. Phase material properties—such as dynamic viscosity or effective viscosity—are available as field functions.