Viewing the Partitioning
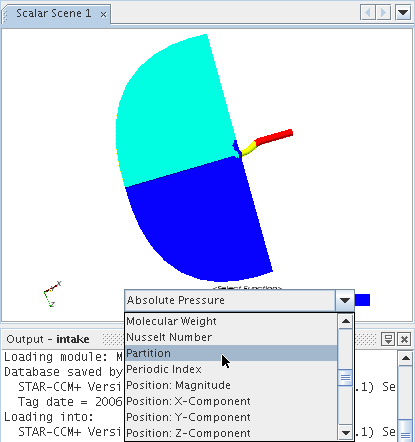
The distribution of the simulation data can be visualized in the same way as any other scalar quantity: adding a scalar scene or adding a scalar displayer to an existing scene, and then changing the scalar quantity selection (the field function) to
Partition. The cells are colored according to the partition that they have been allocated to by
Simcenter STAR-CCM+.

