Analyzing Results
Analyze the contours of temperature for the converged solution.
The contours of temperature on the plane section that is displayed in Scalar Scene 1 are dynamically updated with each time-step.
Adjust the temperature range that is displayed in the scalar scene to help you visualize the results.
- Expand the node.
-
Select the
Scalar Field node and set the following properties:
Property Value Min 300 Max 400 Clip Off
A scene similar to the one shown below is displayed.
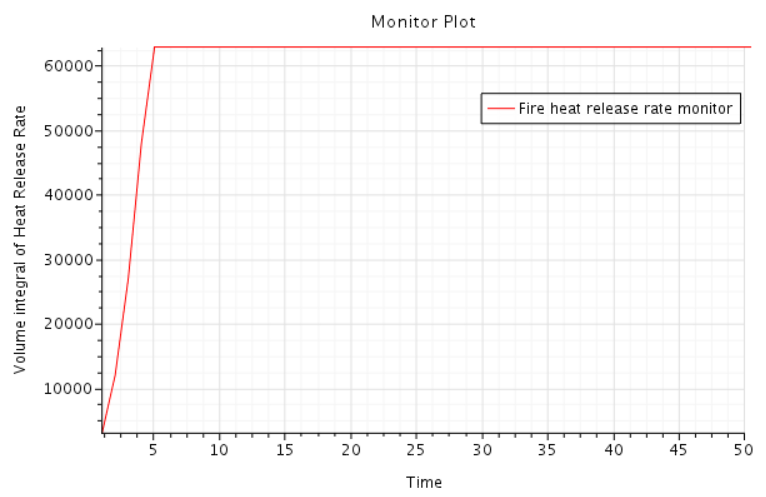
Examine the Heat Release Rate in the Fire region:
- Expand the node.
- Right-click the node and select .
-
Select the
node and set
Maximum to
50.
A plot similar to the one shown below is now displayed.
- Save the simulation.