Plotting the Propeller Performance Data
When complete, the simulation contains all the data that is required to plot the propeller performance data and compare it with the experimental results. The tutorial starting simulation already has a basic plot for you to use.
Begin by exporting the data to a .csv file:
- Expand the Monitors node.
- Multi-select the 10KQ Monitor, KT Monitor, hO Monitor, and J Monitor nodes.
- Right-click on one of the selections and select
-
In the
Save dialog, save the file as
propellerPerformanceData.csv in the working directory.
The data is exported into a single file that contains five columns of data.
- Right-click and select .
- In the Open dialog, select propellerPerformanceData.csv.
Update the plot:
- Expand the node.
- Right-click Data Series and select Add Data.
- In the Add Data Providers to Plot dialog, select propellerPerformanceData and click OK.
-
Edit the
propellerPerformanceData node and set the following properties:
Node Property Setting propellerPerformanceData Legend Name KT X Column J Monitor Y Column KT Monitor  Line Style
Color Black Style Solid Width 2  Symbol Style
Size 10 Color Black Shape Filled Triangle - Create two more data sets from the propellerPerformanceData data, one for the 10KQ data, and the other for the hO data.
-
Edit the
propellerPerformanceData 2 node and set the following properties:
Node Property Setting propellerPerformanceData 2 Legend Name 10KQ X Column J Monitor Y Column 10KQ Monitor  Line Style
Color Black Style Solid Width 2  Symbol Style
Size 10 Color Black Shape Filled Circle -
Edit the
propellerPerformanceData 3 node and set the following properties:
Node Property Setting propellerPerformanceData 3 Legend Name hO X Column J Monitor Y Column hO Monitor  Line Style
Color Black Style Solid Width 2  Symbol Style
Size 10 Color Black Shape Filled Square - Open the Propeller Performance Data plot.
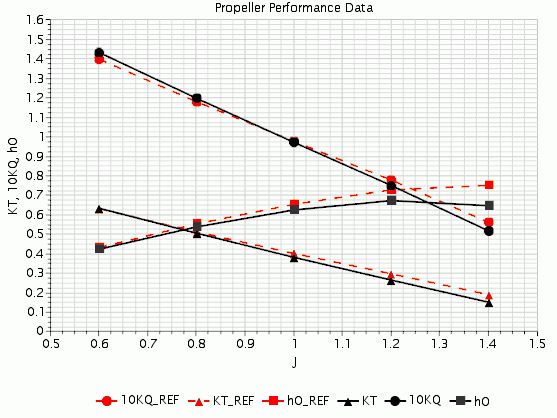
The following plot displays the
Simcenter STAR-CCM+ calculations as black solid lines, and the experimental measurements as red long dashed lines.

