Visualizing the Temperature Distribution
You visualize the temperature distribution of air on two perpendicular section planes through the battery module.
-
Create a new scene to visualize the temperature distribution.
- Right-click on the Scenes node and click and rename the new Scalar Scene 1 to Temperature Scene.
- Expand the Temperature Scene node and double-click on the Outline 1 node to hide it from the scene.
-
Set up the Temperature displayer.
-
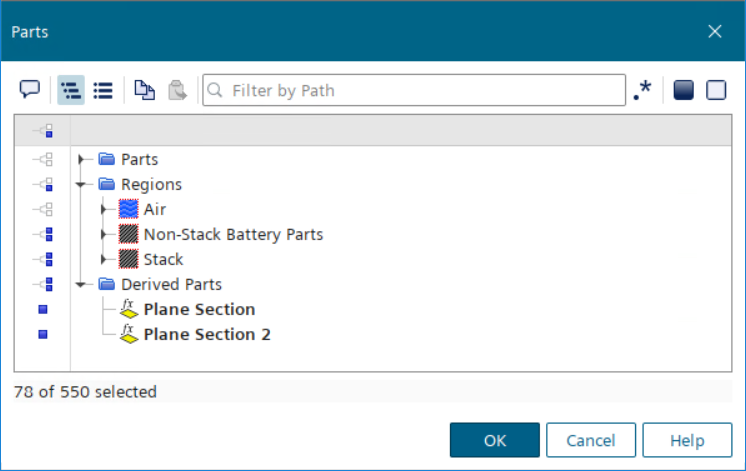
Select the node and set Parts to the following:
- and Plane Section 2
-
Select the Scalar Field node and set the following
properties:
Property Setting Function Temperature Auto Range Off Units C Min 30.0 C Max 700.0 C -
To save the scene to image files, select the node and set the following properties:
Property Setting Trigger Time Step Save To File Activated Output Directory images - Save the simulation.