Visualizing the Results
Visualize the Lithium/salt concentration in the active materials.
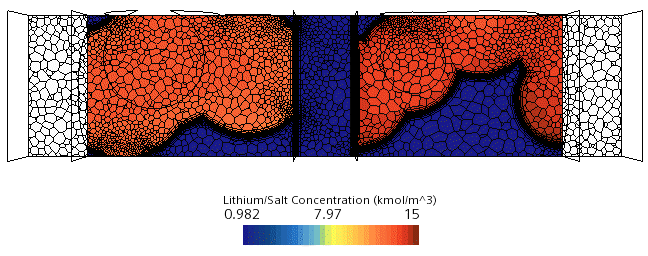
The scalar scene of the Li-Ion/salt concentration looks as follows.

To visualize the Lithium/salt concentration in the active materials:
-
Select the node and click
 (Custom Editor) for the Parts property.
-
In the
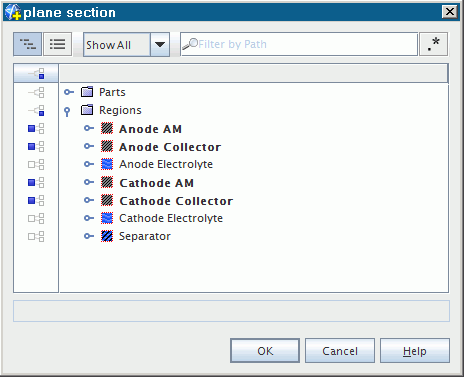
plane section dialog, expand the
Regions node and deactivate
Anode Electrolyte,
Cathode Electrolyte, and
Separator.

- Click OK.
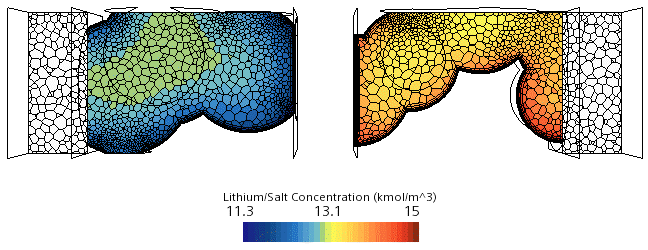
The Lithium/salt concentration in the active materials looks as follows.

On the anode side (left-hand side in the above screenshot), the concentration distribution in the active material indicates a discharge process. The lower level of concentration next to the SEI, compared with the core part, is consistent as the Li+ ions in this region naturally migrate in the electrolyte.
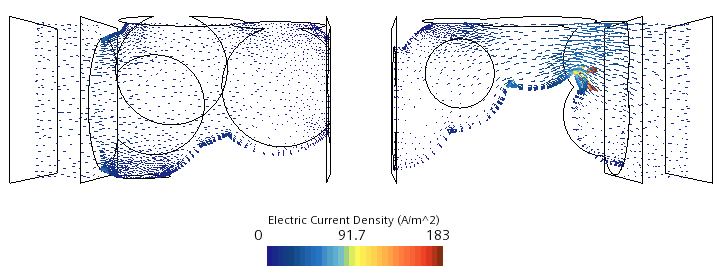
On the cathode side, higher levels of concentration are observed in the region next to the SEI, where the Li+ ions are inserted. The particle next to the current collector has the higher concentration level, which is a result of the high current density in this location.

By reviewing the Li+ ion concentration distribution on this structure, it is possible to observe whether large concentration gradients occur over time. These large concentration gradients are undesirable as they can lead to an increase in cell impedance, which results in large electric potential drop—hence adversely affecting the energy that is delivered by the cell.
Analyzing the current density distribution, especially on the anode side, can give good indications of potential occurrence of certain undesired side reactions, such as lithium deposition. These reactions are more likely to occur in regions of high current density.
This feature allows the cell manufacturer to understand the electrochemical process under a given load, and analyze the effects of various parameters—particle size, porosity, or total electrode thickness—on the cell performance.