Analyzing Results
You examine temperature and pressure on the blade surface.
Temperature
-
The temperature at t = 0.001 s, shown in scalar scene
Temperature, is as follows:
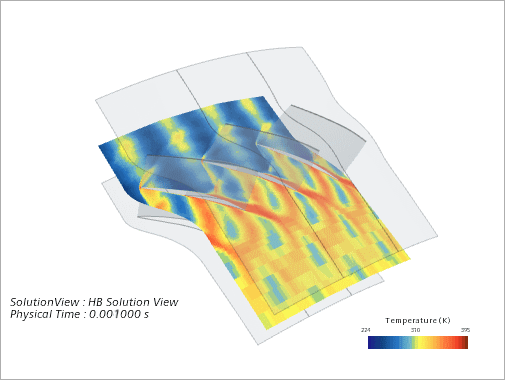
The effect of the wake specification at the inlet boundary can be clearly observed on the temperature plot, along with the effect of the phase angle.
-
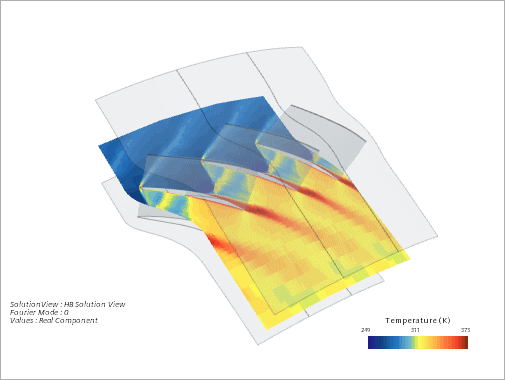
Modify the HB Solution View to display the Fourier mode 0 real solution of
temperature in the three blade passages:
- Select the HB Solution View node and set Mode to Fourier Mode.
- Select the Fourier Mode node and make sure that Mode is set to 0, and Output Option is set to Real.
Obtaining XY Plot of Pressure on the Blade Surface
To plot the pressure profile at different time levels on the surface of the blade, it is first necessary to create a derived part that defines the location of the profile.
- Right-click and select .
-
Right-click the node and select .
The Create Isosurface dialog opens.
-
Click the menu in
Input Parts box.
The Select Objects dialog appears.
-
To clear all selections, double-click the
Column Selection button in the upper left portion of the dialog.
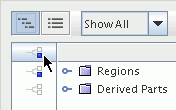
- Expand the node.
-
Select
.
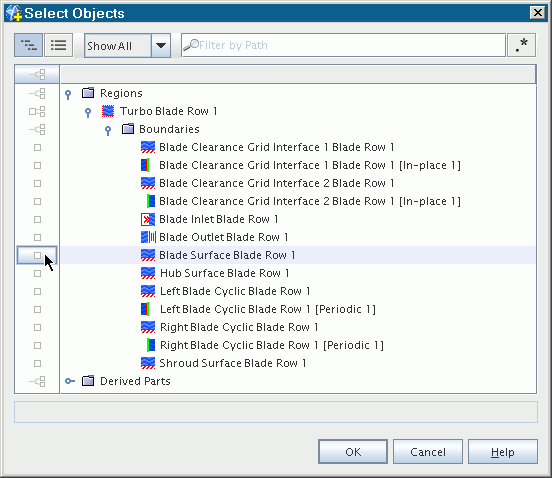
- Click OK.
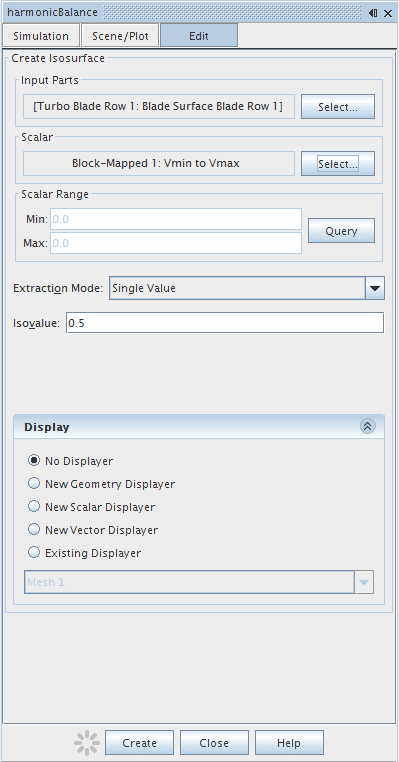
- Click in the Scalar box and select .
- Enter 0.5 in the iso value text box.
-
Select
in the
Display section.
The final panel is as shown below.
- Click Create and then Close.
- Rename the node to Blade 50% Section .
-
Click
 (Hide All Meshes).
-
Click
 (Make Scene Transparent).
The derived part is shown in the following image for illustration.
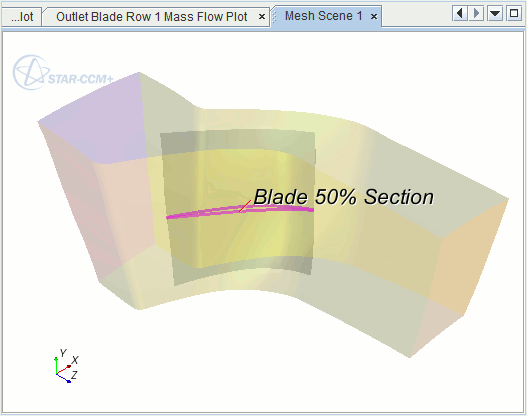
This derived part is now used in an XY plot.
-
Create an HB Solution View on one blade passage for t = 0.001 s.
- Right-click the node and select New HB Solution View.
- Select the node and set Mode to Physical Time.
- Select the node and set Physical Time to 0.001 s.
-
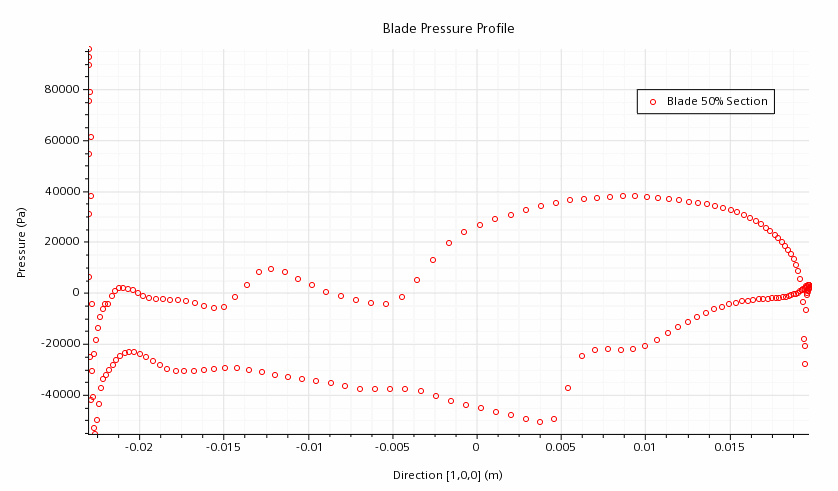
Create an x-y plot to display the blade pressure profile.
The profile plot appears as shown in the Graphics window.
