Visualizing the Temperature
You visualize the temperature distribution on a plane cutting through the center of the mesh.
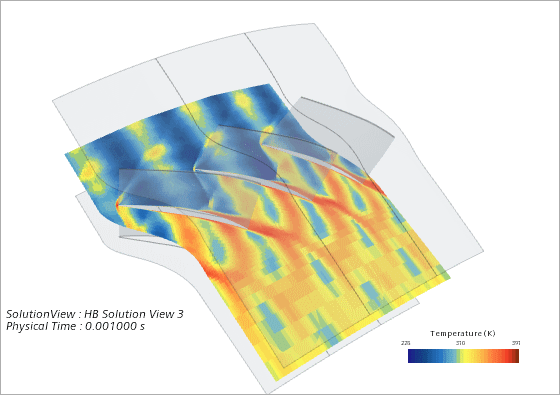
In this tutorial, you visualize the temperature at a physical time of t = 0.001 s on three blade passages using the HB Solution View representation.
To visualize the temperature:
-
Create a scalar scene that displays temperature on a section parallel to hub
and shroud (blade-to-blade view).
-
Select the Scalar Field node and set
Function to
Temperature, then initialize the solution
 .
The temperature distribution that you see is the time-mean solution. This time-mean temperature is displayed on the Volume Mesh representation.
.
The temperature distribution that you see is the time-mean solution. This time-mean temperature is displayed on the Volume Mesh representation.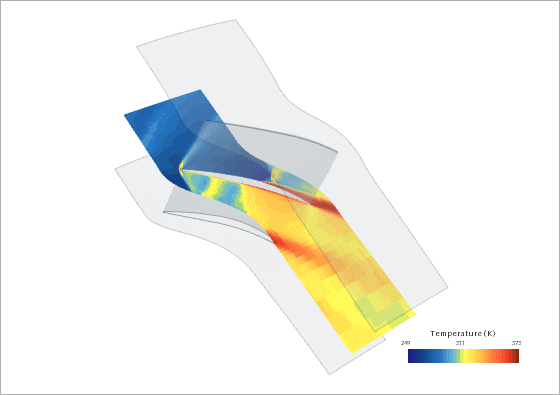
-
Select the Scalar Field node and set
Function to
Temperature, then initialize the solution
-
Create an HB Solution View for a physical time of t = 0.001 s on three blade
passages.
-
Edit the Solution Views node and set the
following properties:
Node Property Setting HB Solution View Mode Physical Time  Physical Time
Physical Time 0.001 s Blade Rows Blade Row 1
Blade Passage Selection [-1, 1]
-
Edit the Solution Views node and set the
following properties:
-
To visualize the time-averaged temperature of the steady-state solution on
three blade passages, select the node and drag-and-drop it onto the graphics window, which
displays the temperature scene.
- Save the simulation.