Visualizing the Results
View the results of the simulation.
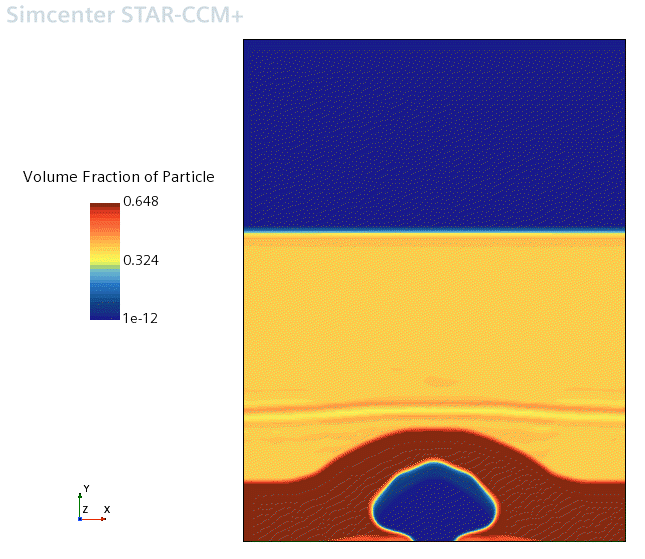
You can visualize the computed solution by viewing the scalar scene in the Graphics window.
To visualize the results of the simulation:
-
Click the
Bubble Shape tab at the top of the
Graphics window.
A bubble has formed at the bottom of the fluidized bed.

Validation data is available for this case. Import this data and use it to validate the prediction of bubble diameter.
To compare the bubble diameter with experimental results:
- Right-click the and select .
- In the Open dialog, navigate to the multiphaseFlow folder of the downloaded tutorial files, select the file kuipers_expt.csv.
- Click Open.
- Right-click the node and select Add Data.
-
In the
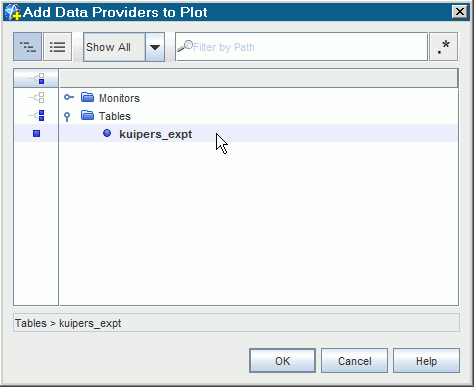
Add Data Providers to Plot dialog, expand the
Tables node and select
kuipers_expt.

- Select the kuipers_expt node and set the Legend Name to Experiment, the X Column to time and the Y Column to dia.
- Select the Line Style node and make sure that the Style property is set to None.
-
Select the
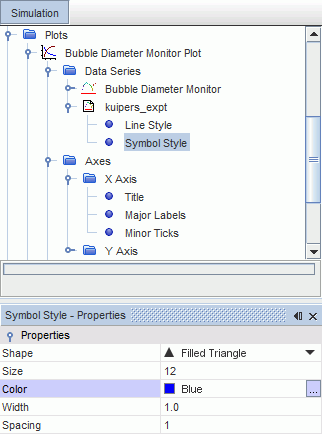
Symbol Style node and do the following:
- Change the Size property to 12.
- Change the Color property to Blue.
- Change the Shape property to Filled Triangle.

- Select the node and set the Maximum to 0.2.
- Select the node and set the Title to Time (s).
-
Select the
node and set the
Title to
Diameter.
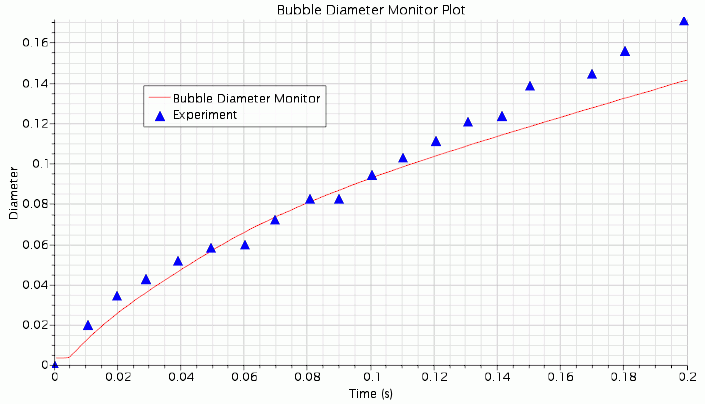
The experimental data now appears in the same plot as the predicted bubble diameter. A reports plot scene appears as shown below:

The results provide a reasonable agreement with the experiment.
- Save the simulation.