Solution Data Interpolation
Many operations require interpolation of solution data between different sets of mesh points. For example, remeshing operations require interpolation of existing solution data onto a new mesh. Data interpolation also occurs at the interface between regions, where contacting boundaries exchange data. Additionally, configurable data mappers allow you to interpolate field functions and tabular data to specified meshes.
Simcenter STAR-CCM+ interpolates solution data from a set of mesh points (source stencil) to another (target stencil). The set of points defining the source or the target stencil can include mesh vertices, cell centroids, or face centroids. For example, for a set of source surfaces with Face stencil, the source stencil comprises the centroids of all faces belonging to the source surfaces. For a set of source surfaces with Vertex stencil, the source stencil comprises all mesh vertices lying on the source surfaces.
For some cases, such as remeshing and manual data mapping, Simcenter STAR-CCM+ allows you to choose the interpolation scheme that is used to transfer data. The available interpolation schemes vary depending on the source and target stencil (face, cell, or vertex), as outlined in the following table:
| Source Stencil | ||||
| Vertex | Face | Cell | ||
| Target Stencil | Vertex |
|
|
|
| Face |
|
|
||
| Cell |
|
|
|
|
The following sections illustrate the shape function scheme in the context of vertex-to-face mapping. All other schemes are illustrated in the context of face-to-face mapping. The formulation can be generalized to other stencil combinations.
In all diagrams, the solution field on the blue mesh (source mesh) is interpolated to the red mesh (target mesh).
Nearest Neighbor Interpolation
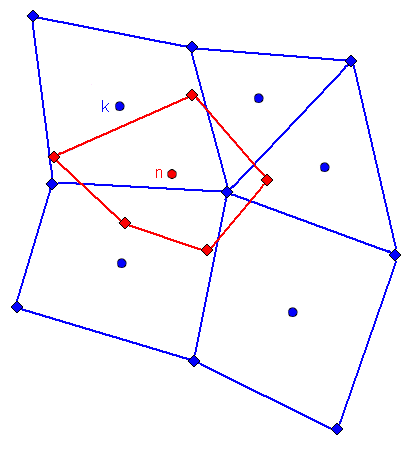
Least Squares Interpolation
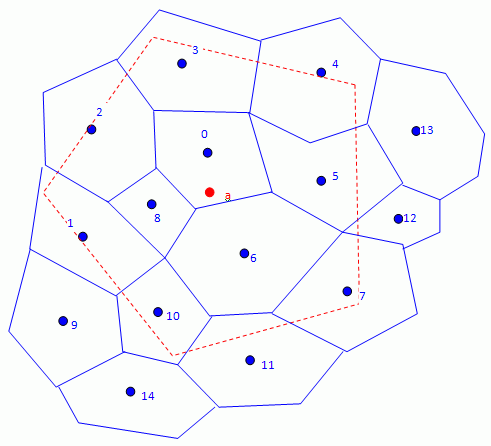
To evaluate the mapped value at the target point , Simcenter STAR-CCM+ approximates the solution field using a first-order Taylor series, centered in :
Only the neighbors of the source face that is closest to the target face contribute to the interpolation. In Eqn. (5227), the set of centroids of the contributing faces is indicated by .
In the diagram, face 0 is the closest to face a. Only the neighbors of face 0, that are defined as any face that shares at least one vertex with face 0, contribute to the interpolation. These neighbors are 2, 3, 4, 5, 6, and 8. The disadvantage is that some of the blue faces that imprint onto the target face (for example 1, 10, 11, 7) do not contribute.
| Note | The least squares method is applicable to all cell types, for face and vertex source stencils. |
Exact Imprinting Interpolation
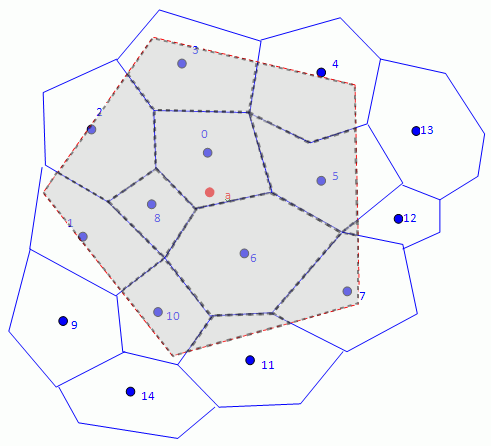
To evaluate the mapped value at the target point , Simcenter STAR-CCM+ uses the normalized facelet areas as interpolation weights:
denotes the set of centroids of faces on the source mesh that intersect the target face. is the solution at the face centroids .
- a flux-preserving mapping is desired
- the source mesh is finer than the target mesh and the surface curvature is adequately resolved
Unlike the least squares scheme, all the source faces that imprint onto the target face contribute to the interpolation.
Mapping with the exact imprint method can fail when surface curvature is inadequately resolved in either the source or target mesh.
Approximate Imprinting Interpolation
This method is a variation of the exact imprinting method in which the source stencil is constructed using proximity checks instead of exact intersections. Proximity checks require less intensive computation than the exact method.
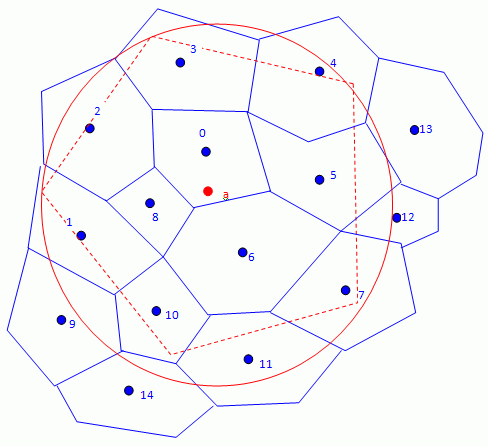
Exact imprinting would eliminate faces 9, 13, and 14 from the stencil because they do not intersect the target face. As for exact imprinting, the normalized face areas are used as interpolation weights.
Although the approximate imprinting method is more robust than the exact imprinting method, it does not preserve flux quantities. The approximate method has comparable accuracy to the exact method when the source mesh is much finer than the target mesh.
Shape Function Interpolation

To evaluate the mapped value at the target point , Simcenter STAR-CCM+ interpolates the solution at the vertices of element k using nodal shape functions:
where is the shape function at vertex , is the solution value at vertex , and denotes the local coordinates of point in the element k. The sum is over the set of vertices of element k, .
The form of the nodal shape functions depends on the element type. For example, a four-node isoparametric quadrilateral in 2D has the following nodal shape functions:
| Note | The shape function scheme is applicable only for triangle and quadrilateral elements in 2D and tetrahedral and hexahedral elements in 3D. |
When mapping with shape functions from a finite element mesh, Simcenter STAR-CCM+ recognizes the element type and uses the relevant shape function for interpolation. Simcenter STAR-CCM+ supports quadratic elements with mid-side vertices. When mapping to a finite element mesh, however, Simcenter STAR-CCM+ only uses corner vertex values for the parametric mapping, without considering mid-side vertices.
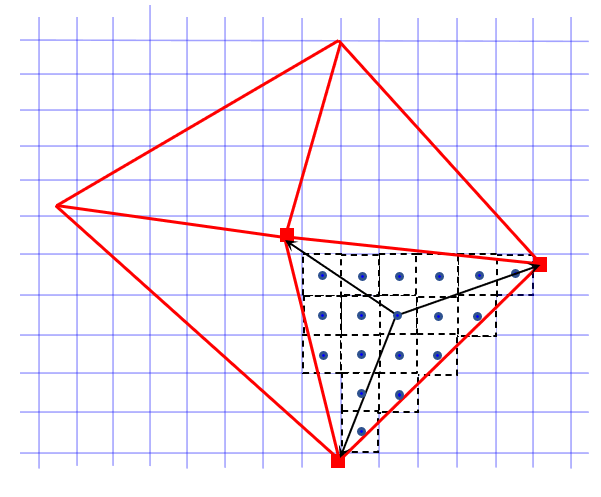
Conservative Enclosed Face
This interpolation method is typically used when mapping data from a fine finite volume mesh to a coarse finite element mesh. The general requirement is the number of source faces is at least three times the number of target vertices.
This method marks for each target element (in red) all the source faces (in blue) with the face centroids lying inside this element. The source faces contribute to all the vertices of this element using inverse of the nodal distance method. Extra conservative constraint ensures the conservation of the physics quantities.
Conservative Maximum Distance
This interpolation method is typically used when mapping data from a fine finite volume mesh to a coarse finite element mesh. The general requirement is the number of source faces is at least three times the number of target vertices.
This method searches for each source face (in blue) the influencing vertices within the circle defined by Number of Influencing Nodes and Maximum Distance, as shown below:
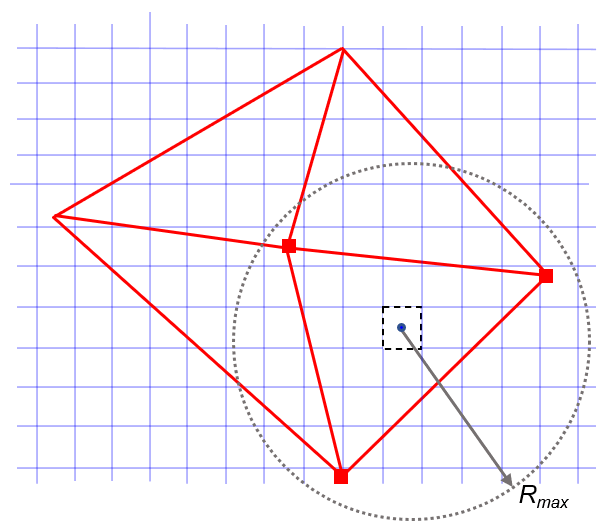
After looping on all the source faces, the mapped field on each coarse mesh vertex is computed as a weighted-sum of the solution from its influencing faces. The interpolation weights are based on rational functions of distance with conservative constraint.
Conservative Correction
Conservation correction is applied to the interpolated solution to ensure that extensive physical variables (for example, mass, momentum, total energy) are conserved after remeshing.
For mass and mass fraction the conservation equation is defined as:
where
is the species index.
is the density in the cell of the old mesh.
is the mass fraction of the species in the cell of the old mesh.
is the density in the cell of the new mesh.
is the mass fraction of the species in the cell of the new mesh.
and
For kinetic energy the conservation equation is defined as:
where
is the velocity component. This formula is valid for all the velocity components .
For total energy the conservation equation is defined as:
For absolute pressure, the volume conservation equation is defined as:
The total Enthalpy is conserved as a result of the conservation equations
Eqn. (5238) and Eqn. (5239).