Checking the Results
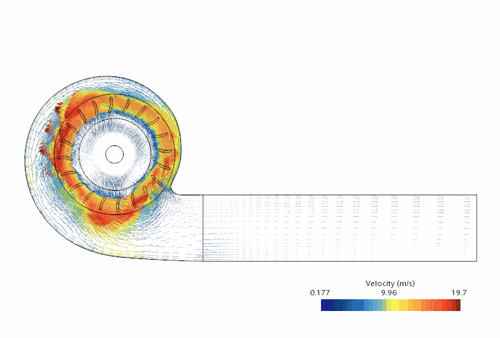
The vector plot is compared with the results for the Moving frame of Reference case.
-
Right-click the
node and select
Open.

These velocity vectors are similar to the vectors that were created during the Moving Reference Frames: Rotating Fan tutorial.
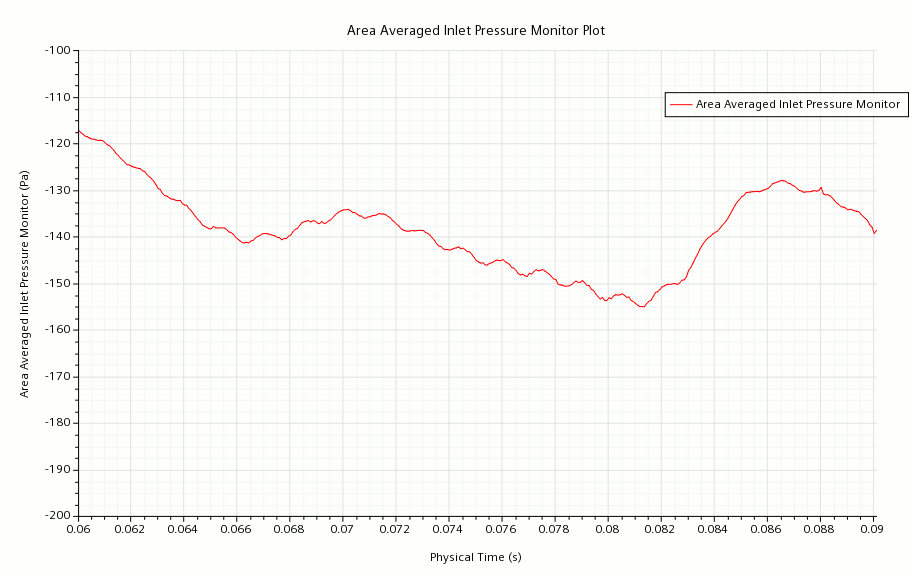
- Click the Area Averaged Inlet Pressure Monitor Plot tab at the top of the Graphics window.
The large scale that is used for the y-axis makes it difficult to assess the inlet pressure variation over the solution cycles.
To update the plot:
-
Edit the
node and set the following properties:
Node Property Setting Left Axis Minimum -200 Lock Minimum Activated Maximum -100 Lock Maximum Activated  Major Labels
Spacing 10.0 Bottom Axis Minimum 0.06 Lock Minimum Activated Maximum 0.09 Lock Maximum Activated  Major Labels
Spacing 0.005 The plot now appears as shown:

| Note | The pressure at the inlet is oscillating with a period of 0.0025 s, that is 1/12 of a revolution, as expected. Over time the amplitude of these oscillations become regular as the flow cycle settles down. |
- Save the simulation.