Reporting and Monitoring with Plots
The monitor plots created in the Thermal Insulator Tutorial are used to monitor the simulation progress.
Simcenter STAR-CCM+ can dynamically monitor virtually any quantity while the solution develops. The process involves setting up a report which defines the quantity of interest and the region parts that are monitored. A monitor is then defined based on the report, which controls the update frequency and normalization characteristics. A graph plot can also be created from the monitor.
Several reports and monitors have already been set up for the solution in the Reporting, Monitoring, and Plotting section of the Thermal Insulator Tutorial.
- Open the Irradiation1 Monitor Plot and Reports Plot plots.
- Create a Surface Average report.
- Rename the report to SpectralBand1Irradiation.
-
Select the
SpectralBand1Irradiation node and set the following properties:
Property Setting Scalar Field Function Parts collector
- Right-click the SpectralBand1Irradiation node and select Create Monitor and Plot from Report.
-
Open the plot display.
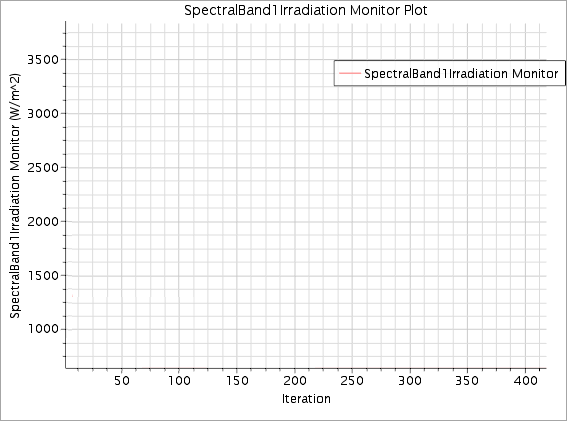
A new plot display that is called SpectralBand1Irradiation Monitor Plot appears in the Graphics window.

This display is automatically updated with boundary solar irradiation data when the run starts.
This completes the pre-processing setup for the case.
- Save the simulation.