Running the Simulation
You can now run the simulation.
-
Click
 (Run) in the toolbar.
The Residuals display is automatically created and shows the progress of the solver.
For this case, however, the
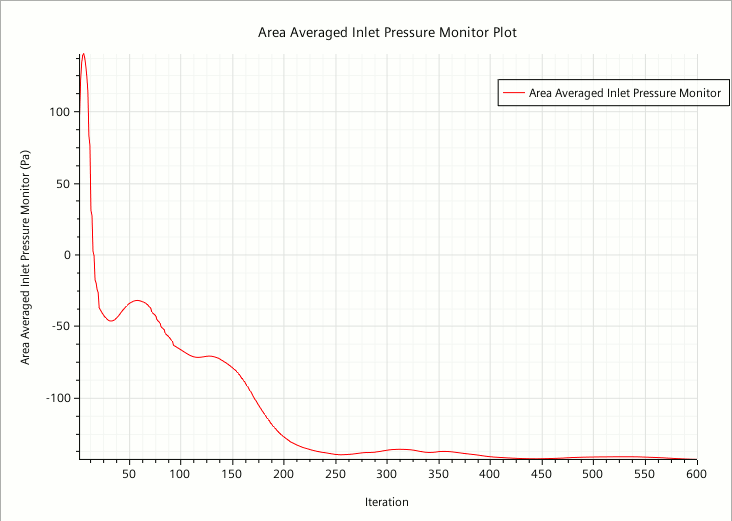
Area Averaged Inlet Pressure Monitor Plot is a
more useful plot to view during the run. The tabs at the top of the Graphics window
make it possible to select any active display for viewing.

During the run, it is possible to stop the solution by clicking the (Stop) button in the toolbar. If you do halt the simulation, it can be continued by clicking the (Run) button. If left alone, the simulation continues until 600 iterations are completed.
At the end of the calculation, the Area Averaged Inlet Pressure Monitor Plot looks as shown below
The pressure at the inlet has almost converged to a steady value. However, it is unlikely to do so completely as the solution to this problem is not truly steady-state.
- Save the simulation.