Visualizing the Results
The Scalar Scene display shows the Mach number profile at the end of the run.
The profile shows the transonic flow around the airfoil, including the shock wave produced behind the supersonic region on the upper surface.
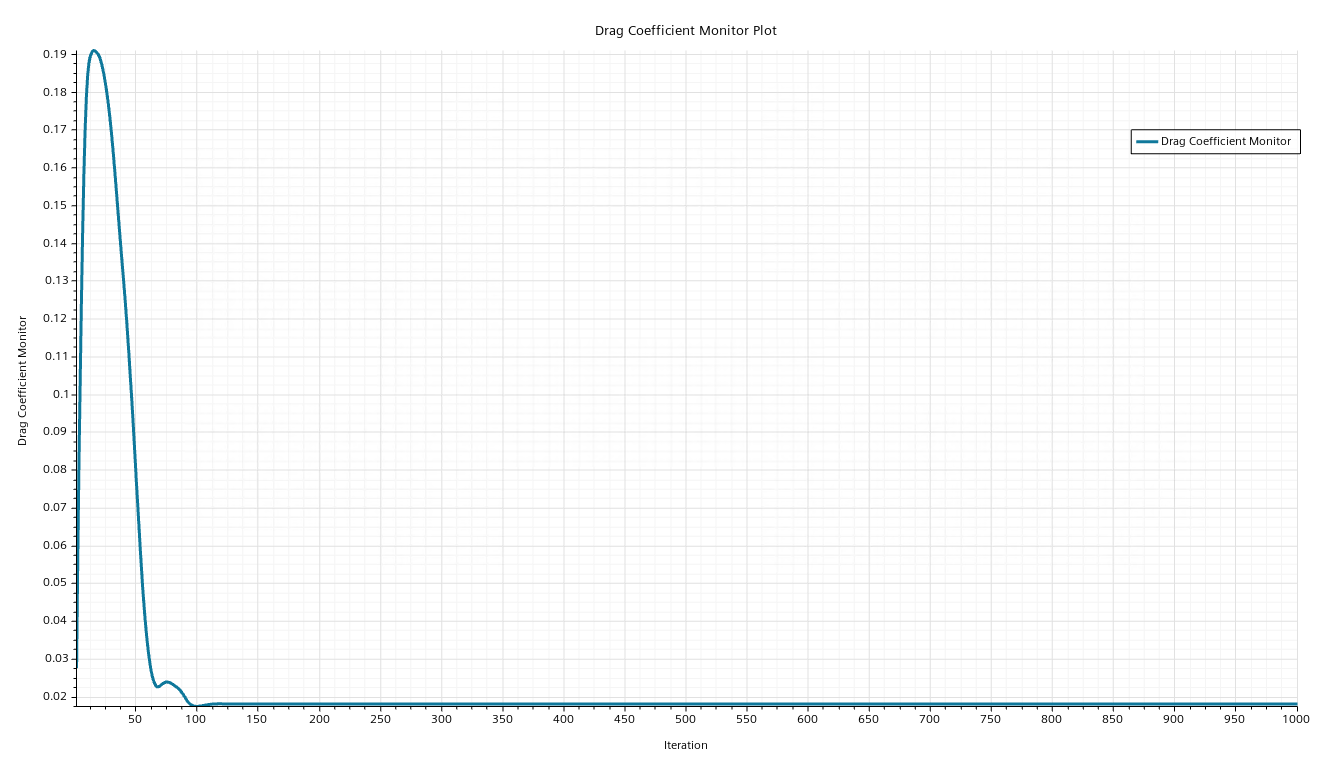
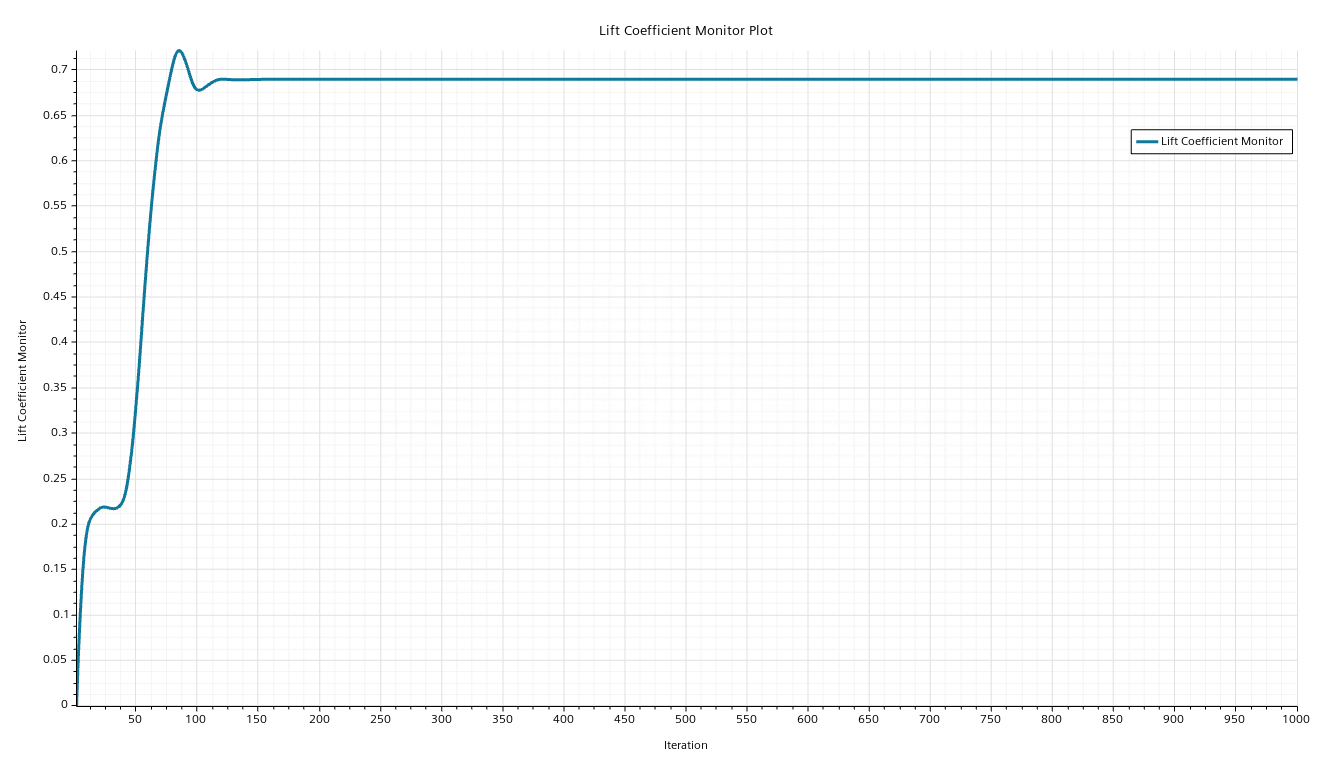
The lift and drag coefficient plots provide a check for convergence. As there is little variation in both monitors, it is reasonable to conclude that the solution has converged.