Comparing Results Using Spectral Analyses
To compare the Lighthill Wave solution with the Perturbed Convective Wave solution, you perform spectral analyses at the microphone and the pressure transducer. Using pre-defined Point Time Fourier Transforms, you transform the time signals (Lighthill pressure, acoustic pressure, and pressure perturbation) to the frequency domain. You display the results using monitor plots.
-
Import the Lighthill Wave results:
- Right-click the node and select .
- In the Open dialog, multi-select the previously exported files MicrophoneLighthillPressure.csv and PressureTransducerLighthillPressure.csv, then click Open.
-
Set up the Point Time Fourier Transforms for the recorded time signals:
-
Add the derived data to monitor plots:
- Save the simulation.


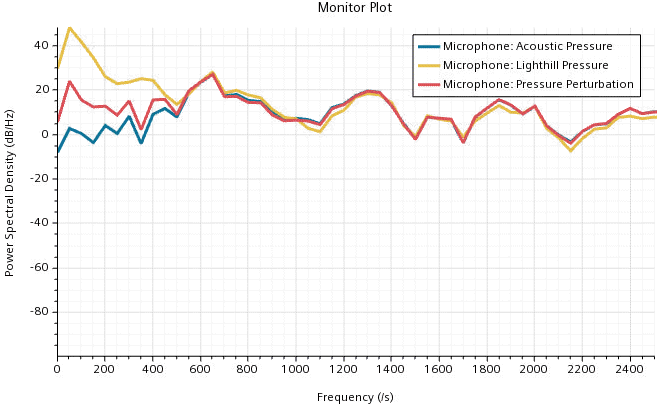
At the microphone, for frequencies > 500 Hz, the pressure perturbation and the acoustic pressure as computed by the Perturbed Convective Wave model show similar results. This indicates that the hydrodynamic pressure at the microphone is negligible in this frequency range. Here, the acoustic pressure also correlates with the Lighthill pressure, which indicates that the Lighthill Wave model is capable of predicting the acoustic pressure at the microphone. Only at low frequencies (< 500 Hz), different values indicate that the received pressure fluctuations are of hydrodynamic nature.
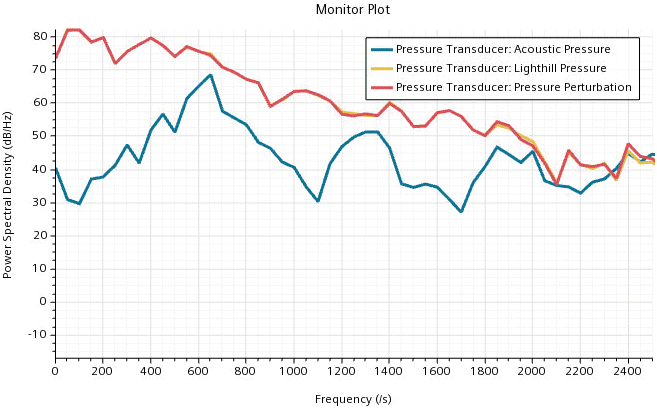
At the pressure transducer, where turbulent fluctuations are dominant, the Lighthill pressure differs significantly from the acoustic pressure. In this region, the Lighthill pressure is not capable of providing information on the noise.
Conclusion: For noise predictions in regions where the hydrodynamic pressure is negligible, the computationally less expensive Lighthill Wave model provides reasonable results. However, in regions where turbulent fluctuations are dominant, only the Perturbed Convective Wave model, which directly solves for the acoustic pressure, can provide insight into the sound field.

