Plotting Reference Data
Display an external data set consisting of experimental data together with the simulation data.
- Right-click the node and select .
- In the Open dialog, select .xy from the Files of Type drop-down menu.
- Navigate to the pressure-ratio-port-wall.xy file (this is located in the compressibleFlow folder of the downloaded tutorial files) and open it.
-
Right-click the
node and select
.

- Select from the Add Data Providers to Plot dialog.
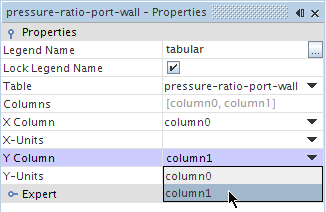
- Select the node.
- Set X Column to .
-
Set
Y Column to
.

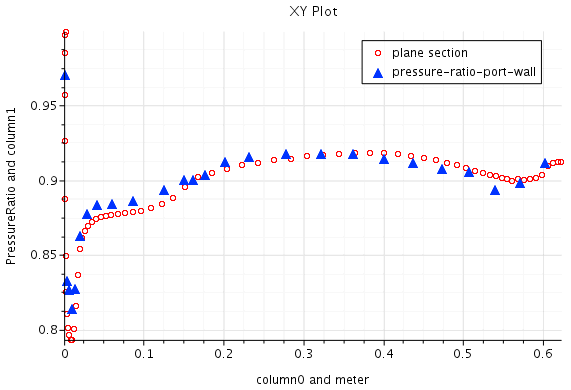
The tabular data is displayed on the plot. To view this more clearly:
-
Select the
node:
The external data appears more clearly.

The external data in the preceding illustration is from the following source: Fluid Dynamics Panel Working Group 13. 1991. “Air Intakes for High Speed Vehicles”, Agard Advisory Report 270, pp. 139-162.
- Save the simulation.
