Visualizing the Shape Optimization
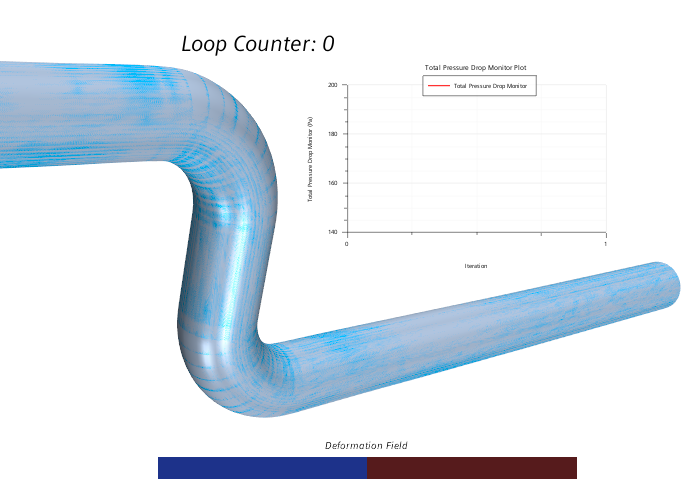
You create a vector scene showing the deformation field vector on the optimized geometry against the original geometry. Add also the total pressure plot as a image annotation in the scene to follow the improvement.
- To create a vector scene, right-click the Scenes node and select .
- Rename the Vector Scene 1 to Deformation Field .
-
To set up the geometry displayer:
-
To set up the vector displayer:
- Select the node and set Parts to Fluid: Wall_Adjoint and Fluid: Wall.
- Select the Vector Field node and set Function to Deformation Field.
-
To create a geometry displayer with the original shape:
- Right-click the displayer Deformed Geometry and select Copy.
- Right-click the Deformation Field node and select Paste.
- Rename the Deformed Geometry copy displayer to Original Geometry .
- Select the Original Geometry node and set Representation to Geometry.
- Click the node and set Color to Sky Blue Deep.
-
To add the total pressure drop plot as a image annotation:
-
To add the current cycle number Loop Counter into the scene:
- Right-click the Reports node and select .
- Rename the Expression 1 to Loop Counter and set the Definition to $LoopCounter.
- Right-click the Loop Counter and select Create Text Annotation from Report.
- Select the annotation and drag it into the vector scene.