Viewing the Results
View the Velocity Magnitude Contour and Wall Y+ Contour scenes.
-
Click the
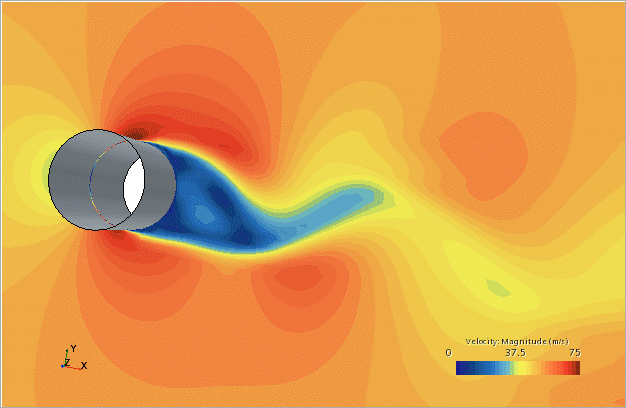
Velocity Magnitude Contour tab.
A scene similar to the one shown below appears.

The above plot illustrates the representative wake field. -
Click the
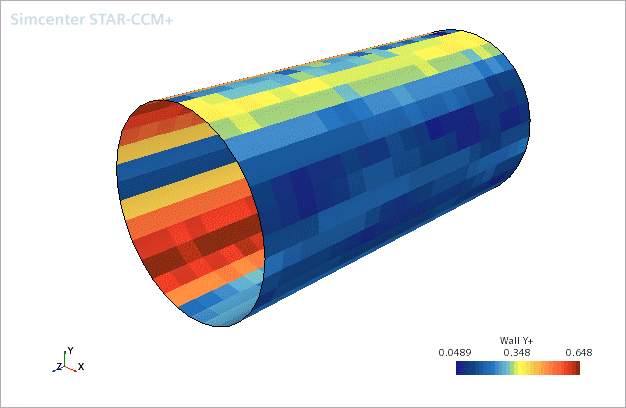
Wall Y+ Contour tab.
A scene similar to the one shown below appears:

Wall Y+ values are everywhere below 1. - Close the Wall Y+ scene in the Graphics window.