Analyzing the Simulation Results
You compare the simulated particle volume fraction distribution with the experimental data and verify that the Morris and Boulay model is suitable for modeling shear-induced particle migration.
To analyze the simulation results:
Examine the volume fraction scene and the corresponding plot to see the simulated particle volume fraction distribution within the Couette device.
-
Open the
Volume Fraction of Particles scene and examine the particle volume fraction distribution.
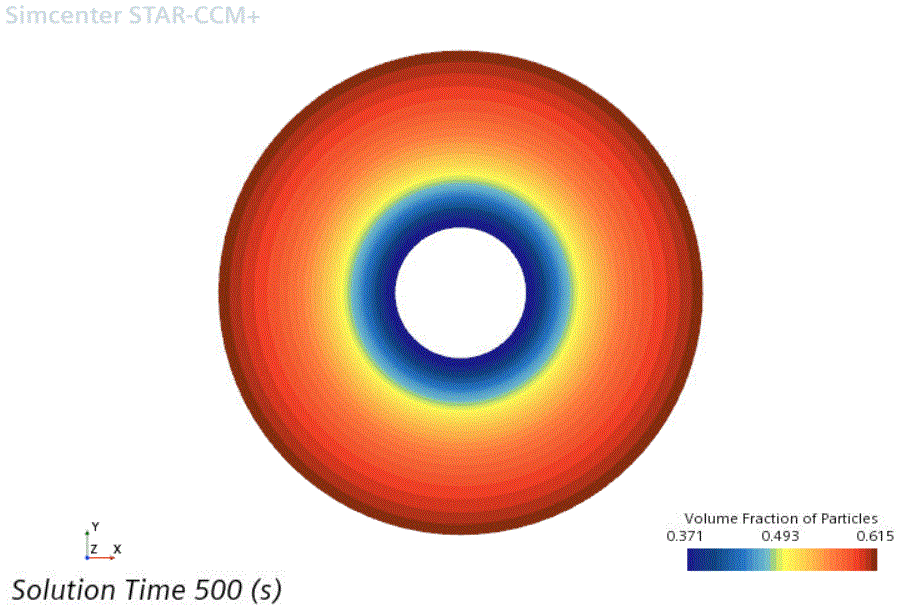
The solid particles have migrated in the shear flow, moving away from the rotating inner wall. The particle volume fraction ranges from a minimum of 0.37 near the inner wall up to a maximum of 0.615 at the outer wall.
-
Open the
Volume Fraction Plot and compare the particle volume fraction distribution with the experimental values.
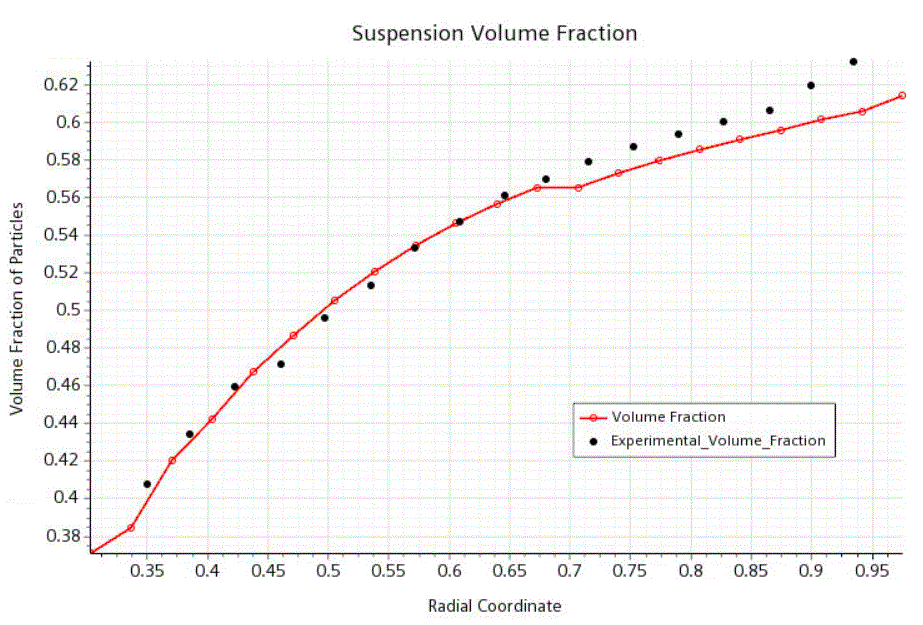
The volume fraction results are a good match with the experimental values across the inner region. In the outer region, the simulation results are low because of the coarse mesh that is used in this tutorial. The use of a finer mesh would capture the migration of particles in more detail.
The particle phase pressure gradient drives the particle migration. Examine the Phase Particle Pressure scene and verify that the pressure gradient is minimal, which indicates that the particle migration has nearly finished.
-
Open the
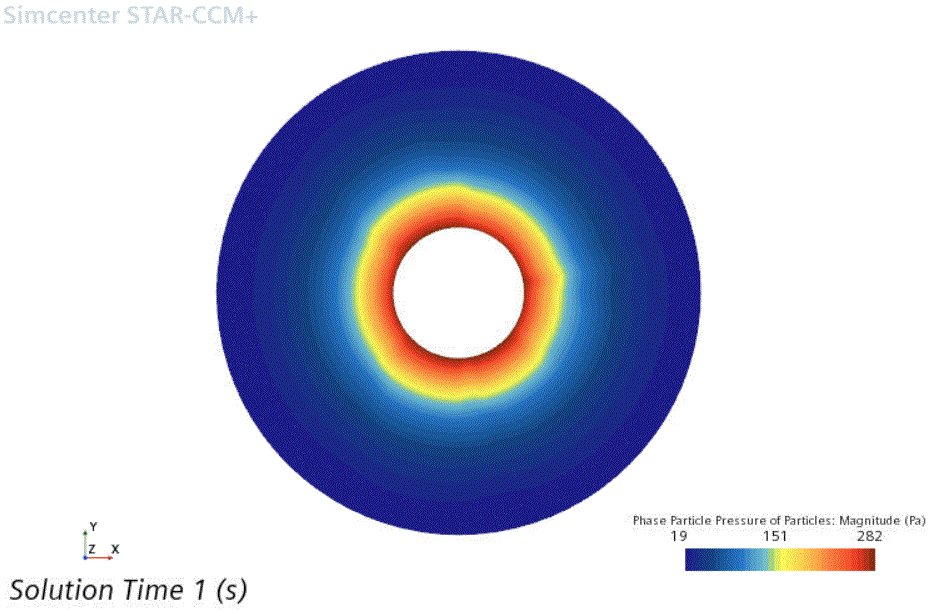
Phase Particle Pressure scene and examine the pressure gradient across the Couette device.
The strong pressure gradient that develops in the first few seconds of the simulation drives the initial surge of particle migration. The example below illustrates the pressure distribution after one second of physical time:
The pressure distribution gradually settles down to a low pressure with a small radial gradient. At the end of the simulation, after 500 seconds of physical time, the phase particle pressure distribution appears as shown:
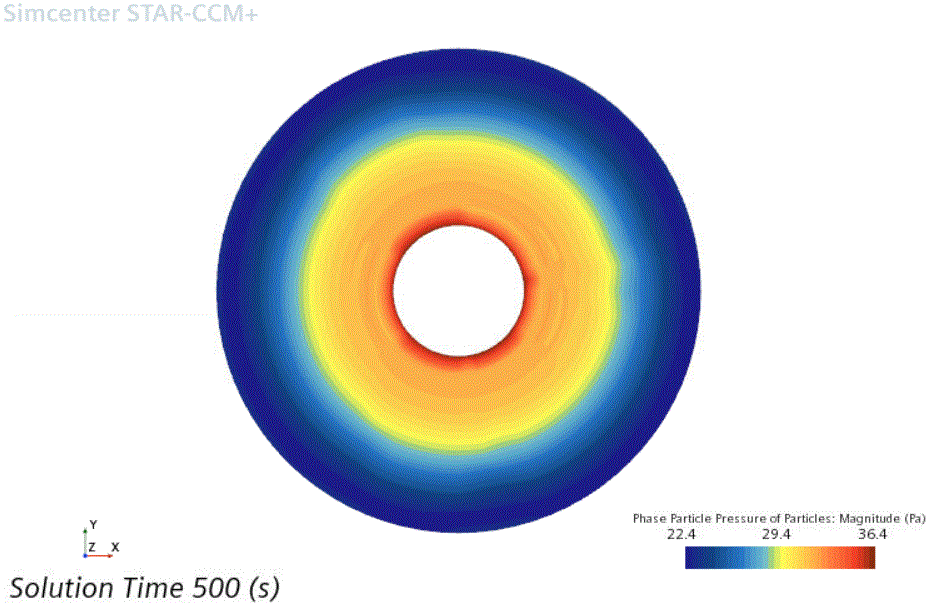
The particle phase pressure varies from about 34 at the inner wall to 22 at the outer wall. This gentle gradient indicates that the particle migration has slowed and the volume fraction distribution is stabilizing.
-
Open the
Velocity of Oil scene and examine the oil velocity distribution.
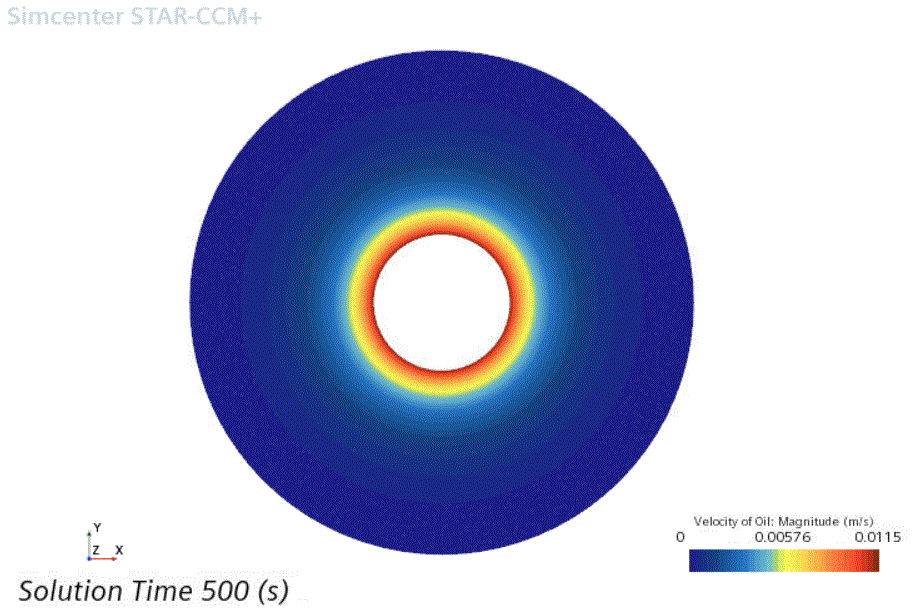
The oil velocity profile settles into a steady state after approximately 300 seconds. In this steady state, the oil velocity decreases with radial distance across the fluid region; this radial variation creates the fluid shear that causes the solid particle migration.
The relative viscosity depends upon the volume fraction of the particles, and increases exponentially as a function of the particle concentration. The viscosity increases towards infinity as the particle volume fraction approaches maximum packing.
-
Open the
Relative Viscosity plot and examine the variation in viscosity with the particle volume fraction.
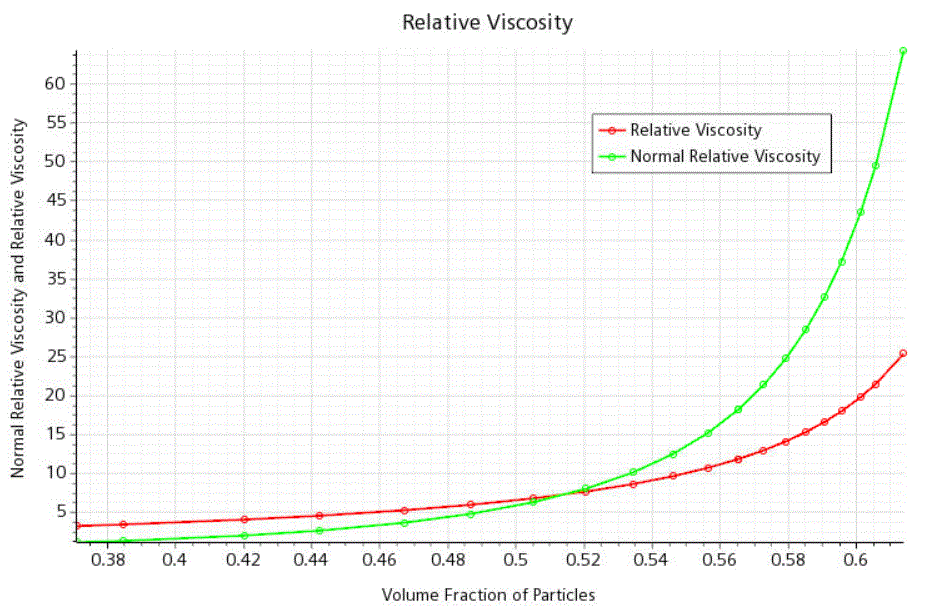
At 500 seconds, the Normal Relative Viscosity is up to 65 at the maximum volume fraction of about 0.615.