Validating the Results
Examine the XY plot and lift coefficient report.
- Select the XY Plot 1 tab.
This plot appears as shown
below.
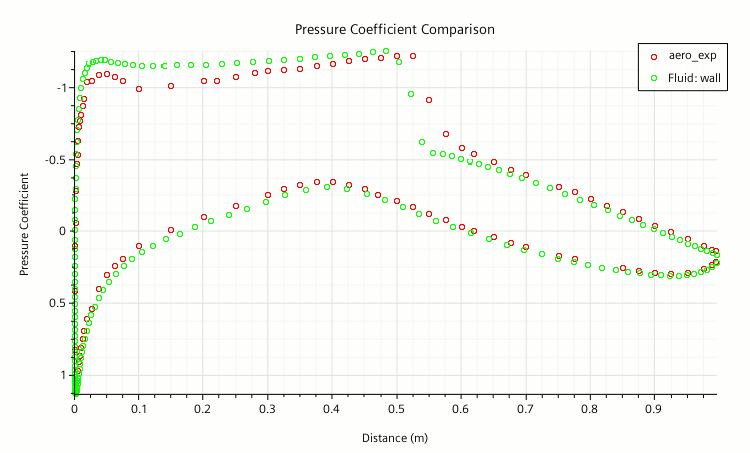
Other than the shock position, which is in error as a result of the mesh coarseness and choice of turbulence model, the numerical pressure coefficients compare well with the experimental data. To see the calculated lift coefficient:
-
Right-click the
node and then select
Run Report.
In the Output window, the Lift Coefficient Report returns a value of 0.787. Similarly, the drag coefficient report gives a value of 0.0164.