Plotting the Blade Load
Assessing blade load is a core study in turbomachinery design. By applying the blade parameterization, you can create a plot in which the pressure profile is unwrapped along the chosen section.
- Right-click the node and select .Along with the new parameterization, Simcenter STAR-CCM+ also adds a corresponding transform, Embedding: Blade 1, within .
- Select the Blade 1 node and set the following properties:
Property Value Pressure-side Blade Surfaces Suction-side Blade Surfaces Axisymmetric Parameterization Axisymmetric 1 Leading Edge (Hovering over an entry in the dropdown list reveals the full path to the entry).
Trailing Edge On completion, the parameterization adds the following field functions that you can use within derived parts and other objects: - Create derived parts that each define a curve from blade root to blade tip on either side of the blade:
- To create the final plot:
- Edit the Blade 1 Loading Plot node and set the following properties:
Node Property Value Blade 1 Loading Plot Title Blade 1 Pressure Load Parts  X Type
Data Type Scalar  Scalar Function
Field Function  Scalar Function
Field Function Absolute Pressure Blade 1 centerline PSSort Plot Data Activated Style Solid (Hover over entries to see their labels)
Blade 1 centerline SSSort Plot Data Activated Style Solid
The unwrapped blade loading plot appears as follows: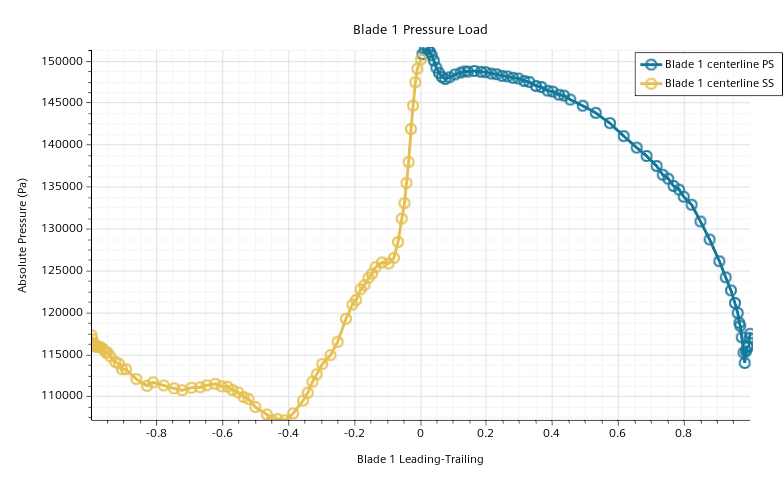
- Edit the Blade 1 Loading Plot node and set the following properties: