Visualizing the Results
Examine the velocity vectors and magnitude map.
-
At the end of the calculations, open the
node and double-click the
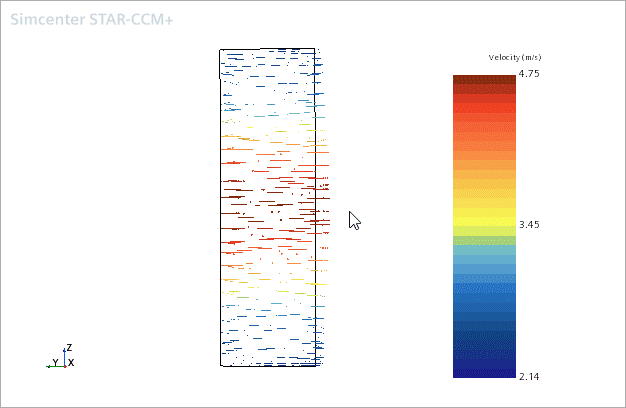
node to display the velocity vectors in the porous region.

The flow in this porous medium is essentially unidirectional.
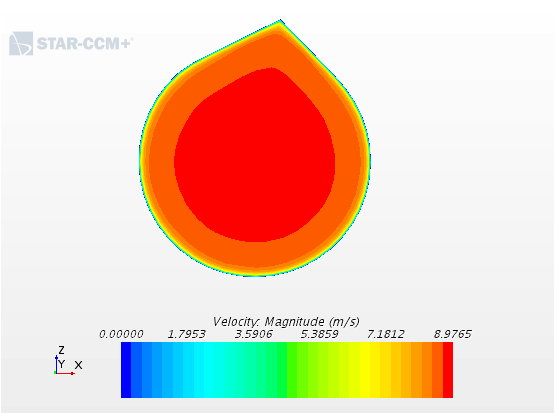
Examine how the porous properties affect the flow downstream of the porous region by comparing velocity magnitude contours at the outlet from the two simulations side-by-side.
- Right-click the node and select .
- Select the displayer node and deactivate the Outline property.
- Select the displayer node and set Contour Style to
- Select the node and add to the Parts list.
-
In the
Graphics window, right-click the legend color scale and select
from the list.

-
Click
 in the toolbar and select
.
-
Using the click and drag technique, expand the width and the height of the color bar. Drag the color bar to a suitable location.
The velocity magnitude contours on the outlet boundary plane are displayed.

- Save the simulation.