What Are Reports, Monitors and Plots?
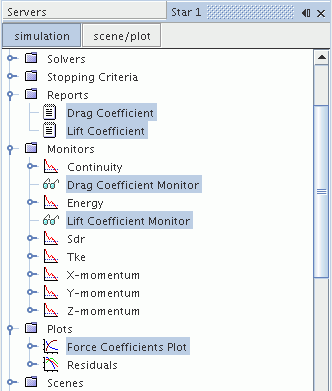
Reports provide a computed summary of simulation or system data.
They are contained within the manager node in the object tree, and have varying properties that depend on their type.
Monitors provide a mechanism for sampling summary information from the simulation during runtime. Some built-in monitors are provided for residuals that the various solvers compute. User-defined monitors can be created based on reports that are contained within the Reports manager node.
Plots provide line graphs containing information that is supplied from; monitors, extracted simulation data, tables, or derived data sets. These plots can be customized with different line and point properties, axes, scales, titles, and so on.
