Correlations for ReTheta_t
A well-established correlation for was developed by Abu-Ghannam and Shaw [374].
In the case of a zero pressure gradient, this correlation is:
where is the turbulence intensity.
An alternative expression, developed for the Gamma ReTheta transition model by Menter et al. [380] is:
and this was later revised by Langtry [378] with a view to improving the results at lower free-stream turbulence intensities, as follows:
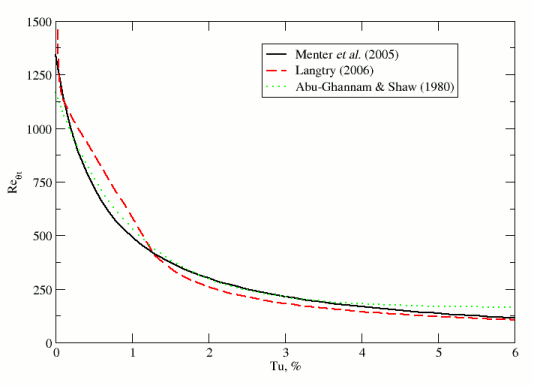
The three zero-pressure gradient correlations are plotted in the following figure. All three are provided in Simcenter STAR-CCM+ to allow the user flexibility to customize the correlations, but Eqn. (1530) is the default correlation used in the internal “Suluksna-Juntasaro” calibration.

vs. Free-Stream Turbulence Intensity
The three correlations presented for zero pressure gradient in Eqn. (1528) through Eqn. (1530) were originally presented in a form that include the effects of a pressure gradient. There is some doubt that the pressure gradient effects are required in the correlation [385], since they arguably introduce a double-accounting of the pressure gradient effects, but they are nevertheless optionally included in Simcenter STAR-CCM+. In the presence of a pressure gradient, the correlations require the computation of the Thwaites parameter, , and in the case of the Menter et al. [380] correlation, the acceleration parameter, .
Thwaite’s parameter is defined as:
where:
- is the kinematic viscosity.
- is the mean velocity vector.
The parameter is defined as:
denotes the wall-parallel direction, where the local coordinate system is constructed using the flow direction and the wall-normal direction.
The turbulence intensity is obtained from the turbulent kinetic energy as follows:
The streamwise velocity gradient is calculated as:
where denotes the transpose of .
Since the momentum thickness must be derived from the momentum thickness Reynolds number , the correlation becomes an implicit function that is solved iteratively.
The non-zero pressure gradient (NZPG) correlation of Abu-Ghannam and Shaw [374] is:
where:
For numerical robustness, the following limits are applied:
The NZPG correlation of Menter et al. [380] is:
where:
For numerical robustness, the following limits are applied:
The NZPG correlation of Langtry [378] is:
For numerical robustness, the following limits are applied:
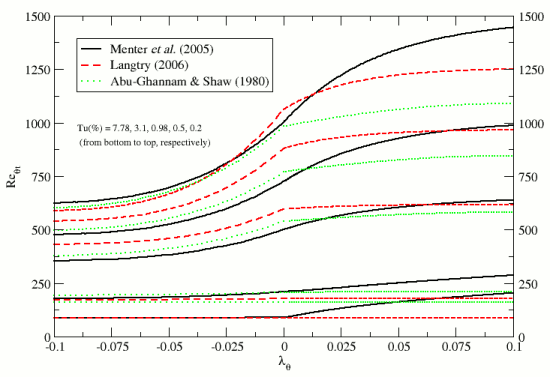
A comparison of the three NZPG correlations is shown in the following figure for a range of free-stream turbulence intensities.

vs. for various values of Free-Stream Turbulence Intensity