Visualizing Results
View the results of the simulation.
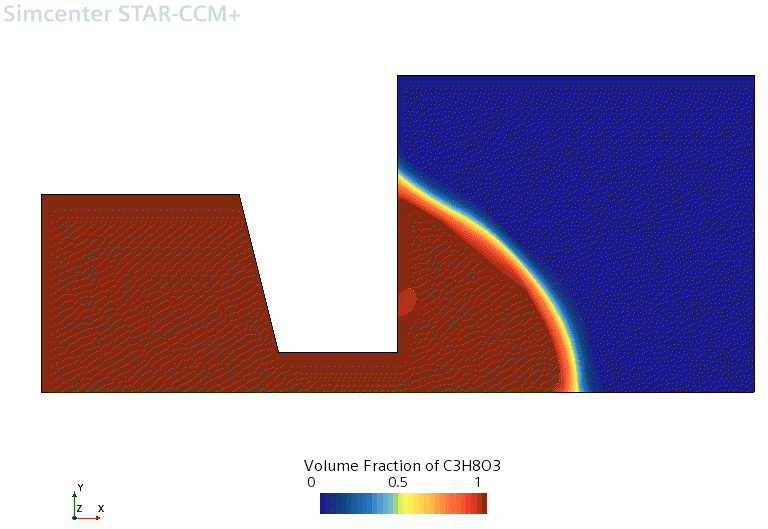
The Scalar Scene 1 display shows the glycerine volume fraction profile at the end of the 2.0 s run. The observable contact angle is indeed close to 45o.

To view the results of the simulation:
- Right-click the scalar bar in the display.
-
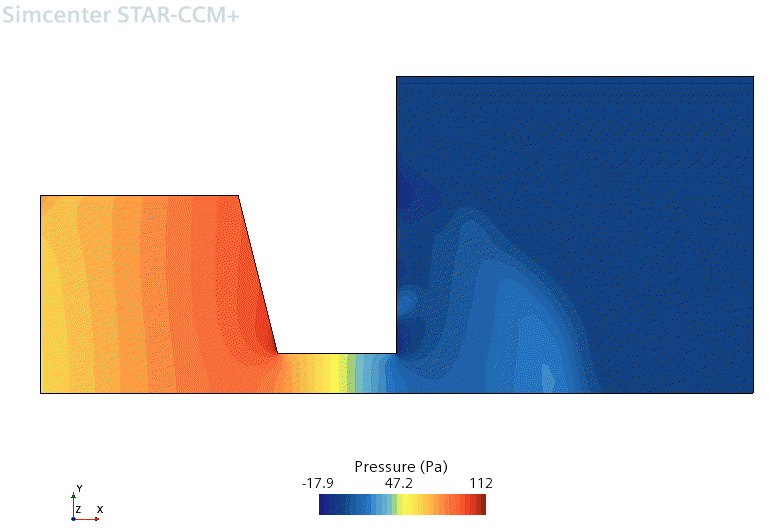
Select Pressure from the pop-up menu to display the
pressure profile.

To display velocity vectors:
-
Right-click the Scenes node and select .
The vector scene appears in the Graphics window.

The velocity vector plot shows high air velocities close to the free surface. These numerical inaccuracies are known as parasitic currents. These currents arise because the surface tension and pressure forces are much larger than all other terms in the momentum equations, and their balance on an irregular grid is difficult to achieve numerically due to the discontinuous variation of pressure across the free surface and a large discretization error that is associated with it. Parasitic currents become appreciable when the problem size is small and fluid velocity and viscosity are low. For flows where diffusion and convection forces are of a similar magnitude to surface tension forces, these problems are not so pronounced. Since artificial velocities are generated only within the air, their effect on the liquid flow (which is usually what you are trying to predict) is small.
- Save the simulation.