Fuel Saturation Distribution

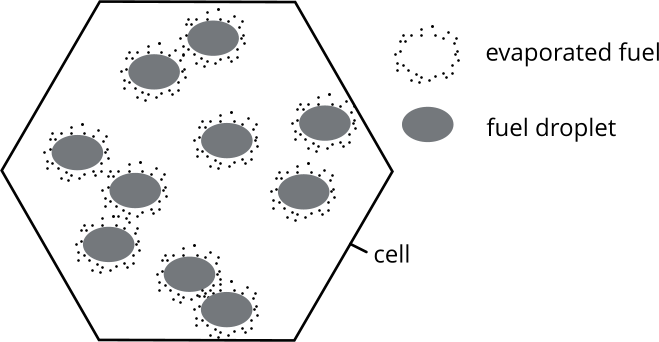
Before fuel droplets evaporate and mix homogeneously throughout a cell, the evaporated fuel is initially located in close proximity to the fuel droplets. The Fuel Saturation Distribution model uses a fuel mass fraction profile to account for the initially uneven distribution of fuel mass fraction in a cell.


The Fuel Saturation Distribution model recognizes three zones related to the distance from fuel droplets.
Mass Fraction Profile Zone Fuel Mass Fraction Mass Fraction Analytical Profile of Z ˜ F ( x )
1

Uniform zone with a fuel mass fraction corresponding to saturation conditions near the surface of the fuel droplets.

Z ˜ F U M Z ˜ F ( 0 ) = Y ˜ F S Z ˜ F ( x ) = Y ˜ F S x [ x f s , 0 ]
2

A linear zone between the saturation conditions and the perfectly mixed zone.

Z ˜ S P U M Z ˜ F U M Z ˜ F ( x ) = Z ˜ Z ˜ F ( x ) = Y ˜ F S + Z ˜ Y ˜ F S x x x [ 0 , x ]
3

Uniform zone with a perfectly mixed fuel mass fraction.

Z ˜ F Z ˜ S P U M Z ˜ Z ˜ F ( x ) = Z ˜ x [ x , 1 x f s ]


Z ˜ S P U M and Z ˜ F U M are given by the following transport equations:
Figure 1. EQUATION_DISPLAY
( ρ ¯ Z ˜ S P U M ) t + ∇⋅ ( ρ ¯ v ˜ Z ˜ S P U M ) = ∇⋅ ( ρ ¯ D Z ˜ S P U M ) + S ˜ T ˜ S P U M
(3949)
Figure 2. EQUATION_DISPLAY
( ρ ¯ Z ˜ F U M ) t + ∇⋅ ( ρ ¯ v ˜ Z ˜ F U M ) = ∇⋅ ( ρ ¯ D Z ˜ F U M ) + S ˜ T ˜ F U M
(3950)
in which S ˜ is the droplet evaporation source term. T ˜ S P U M and T ˜ F U M are transfer terms from non-mixed non-homogenous zones to the completely mixed and homogenous profile zone 3. T ˜ S P U M and T ˜ F U M are assumed to be given by:
T ˜ S P U M ( Y ˜ F S defined)
Figure 3. EQUATION_DISPLAY
T ˜ S P U M = ρ ¯ K s p u m [ Y ˜ F S Z ˜ ] C ( Re t ) τ Z ˜ S P U M
(3951)
( Y ˜ F S not defined)
Figure 4. EQUATION_DISPLAY
T ˜ S P U M = ρ ¯ K s p u m C ( Re t ) τ Z ˜ S P U M
(3952)
T ˜ F U M ( Y ˜ F S defined)
Figure 5. EQUATION_DISPLAY
T ˜ F U M = ρ ¯ ( K s p u m + K f u m ) [ Y ˜ F S Z ˜ ] C ( Re t ) τ Z ˜ F U M
(3953)
( Y ˜ F S not defined)
Figure 6. EQUATION_DISPLAY
T ˜ F U M = ρ ¯ ( K s p u m + K f u m ) C ( Re t ) τ Z ˜ F U M
(3954)
The fuel mass fraction at the surface of the droplets Y ˜ F S in a given cell, assuming saturation conditions at the liquid-gas interface, is given by:
Figure 7. EQUATION_DISPLAY
Y ˜ F S = P s a t M W , F M W , S P
(3955)
  • P s a t is the saturation vapor pressure (given by a saturation curve of the specified fuel as a function of the temperature of the fuel droplets).
  • M W , F is the molar weight of the fuel.
  • P is the gas pressure within the cell.
  • M W , S is the molar weight of the gas mixture at the surface of the droplets within a cell.