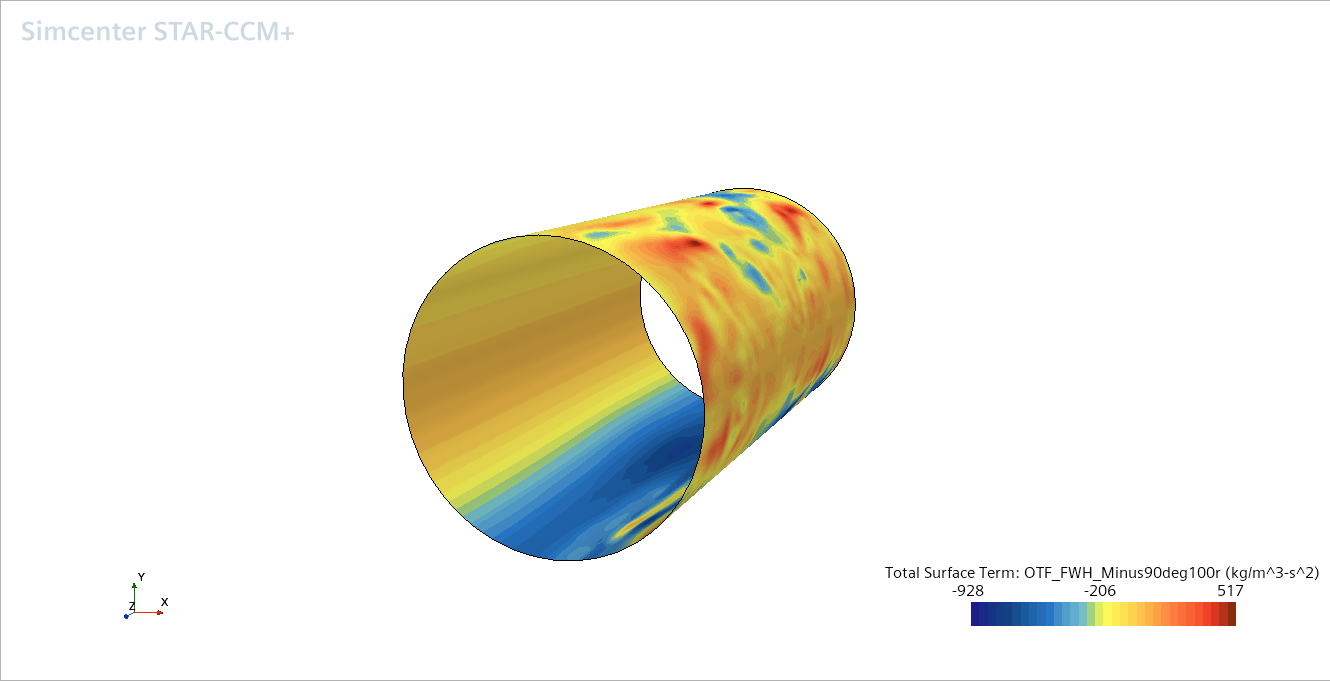
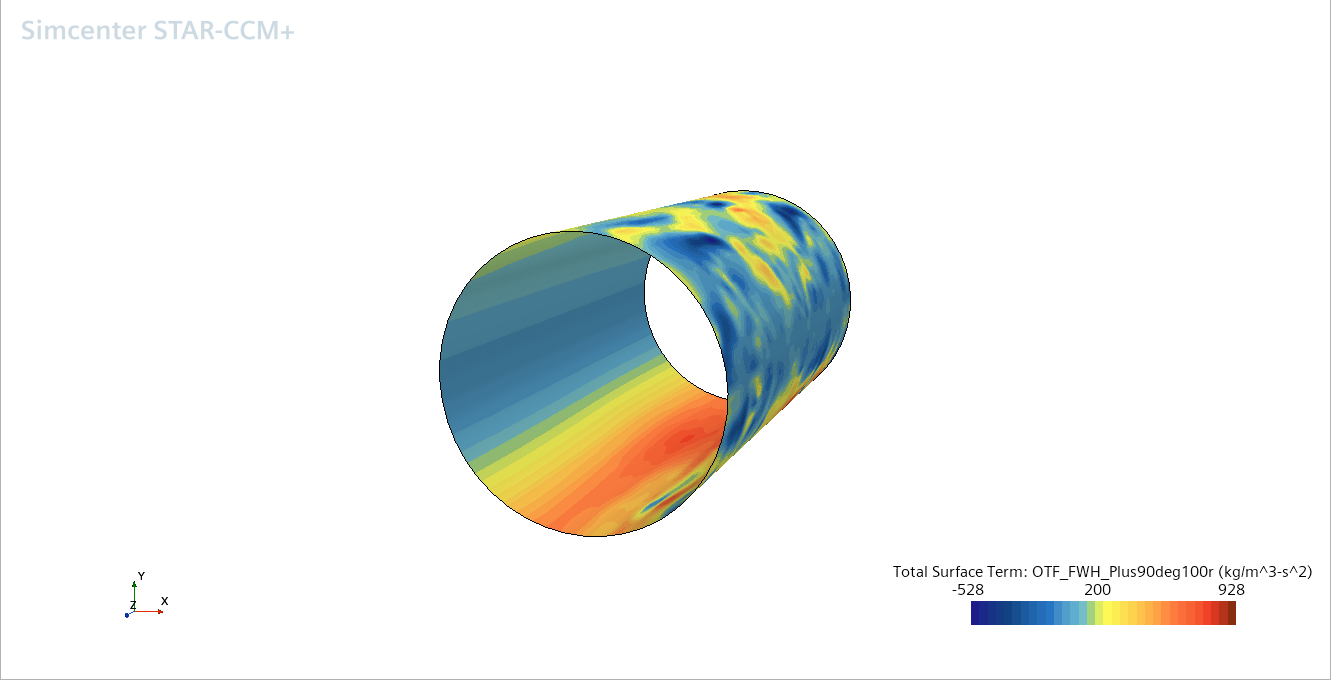
Visualizing the Results
You can now visualize the acoustic pressure on the cylinder, based on input from the two point-receivers.
-
Open the node . A scene similar to the one shown below is displayed.
-
Open the node . A scene similar to the one shown below is displayed.