Visualizing the Results
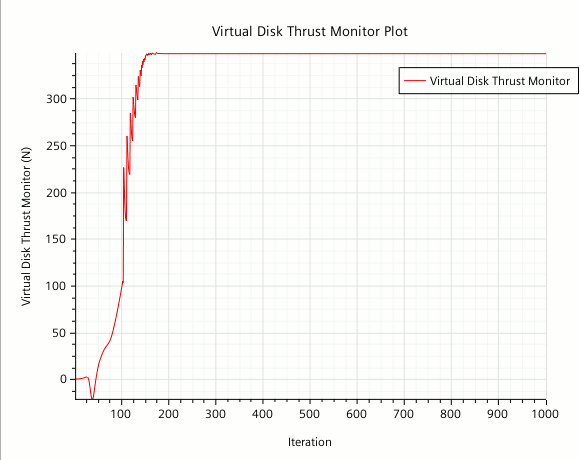
You can follow the progress of the solution using each of the plots and scenes that you created previously.

Here, you see the corresponding graph of the collective pitch angle as a function of iteration.

Using these two graphs, you can monitor the trimming process, that is, you can follow the change in collective pitch angle and its corresponding change of thrust. For the first 100 iterations, the rotation rate is ramped linearly from 1 to the specified value of 2000 rpm. During this period, the collective pitch angle remains constant at the specified value of 7.7°. After 100 iterations, Simcenter STAR-CCM+ activates the trimming algorithm. You can see that the collective pitch angle increases non-linearly to reach a constant value after approximately 500 iterations as the run converges. When the trimming algorithm is active, the thrust is computed using the varying collective pitch angle. The collective pitch angle is adjusted until the specified target thrust is reached.
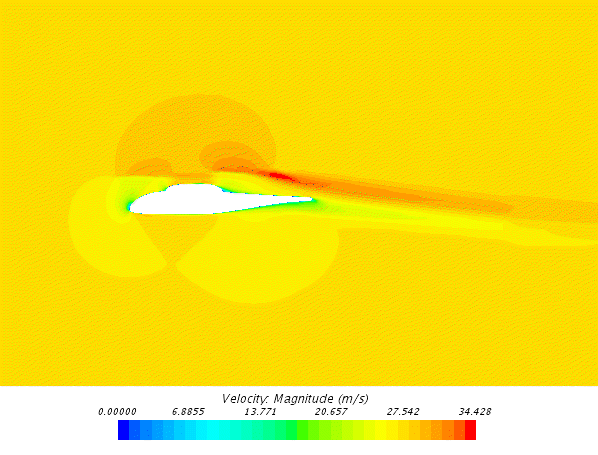
The following screenshot shows you a close-up of the velocity contours around the helicopter fuselage.

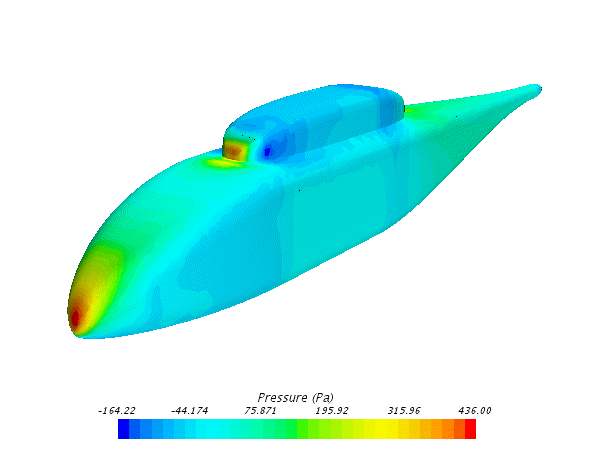
Next, you can see the pressure contours on the helicopter fuselage.

This plot allows you to analyse the aerodynamic loads on the helicopter body. You can also export this data to an external program for further structural analysis.