Analyzing the Solution
To analyze the results for the thermal comfort analysis, you open the relevant plots and scenes.
-
Open the Equivalent Homogeneous Temperature 1,
Fiala Dynamic Thermal Sensation 1 Monitor Plot,
Fiala Predicted Percentage Dissatisfied 1 Monitor
Plot plots.
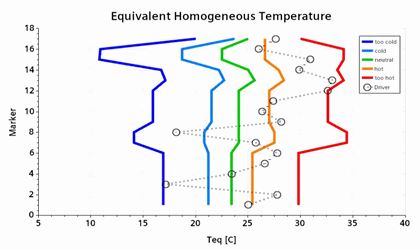
The Equivalent Homogeneous Temperature plot shows that most segments are in the hot or too hot range. In particular, the left arm and shoulder segment (markers 12 and 13) are approaching the too hot barrier. The right calf is moving toward the too cold barrier.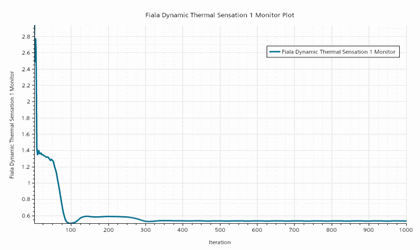
The final Fiala Dynamic Thermal Sensation for this case is around 0.531. Comparing this global value to the ASHRAE 7 point scale, you can determine that, overall, the manikin driver is between neutral and slightly warm.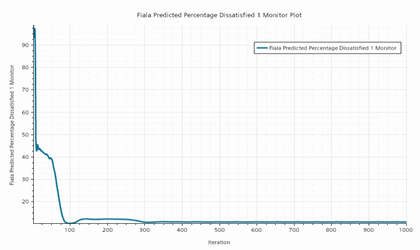
For this simulation, around 10.9 % of the population would be uncomfortable under the current conditions. -
Open the Driver Clothing Temperature and
Driver Skin Temperature scalar scenes.
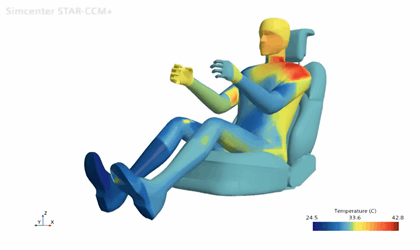
Looking at the clothing temperature scene, you can see the majority of the lower and core regions of the body sit at below body temperature, with the right foot approaching 24.5 °C. The left shoulder on the other hand is slightly warmer than body temperature.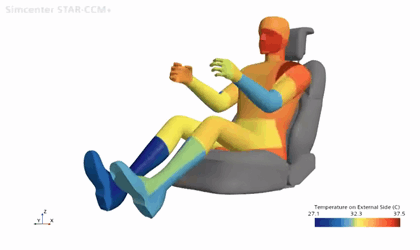
Looking at the skin temperature, the majority of the body sits around 37.5 °C (human body temperature). As you move to the lower half of the body and especially the feet, the skin temperature reduces by up to 10 °C. This is due to the non-uniform and dynamic cabin thermal environment as per the given input conditions. Hence controlling the air flow around the feet and legs should improve the overall thermal comfort solution.