Run the Design Study and View Design Results
Define the Run Settings for the design study.
-
Select the node and set Compute
Processes to a minimum of
12.
Compute Processes specifies the number of cores used for each design.
For this case, the Simultaneous Jobs setting is not relevant, as the designs run sequentially.
- To launch the design study, right-click the Design Study and select Run Study.
Once the design run starts, you see immediately a
pre-configured layout view with the most important design results of the smart sweep
study.
-
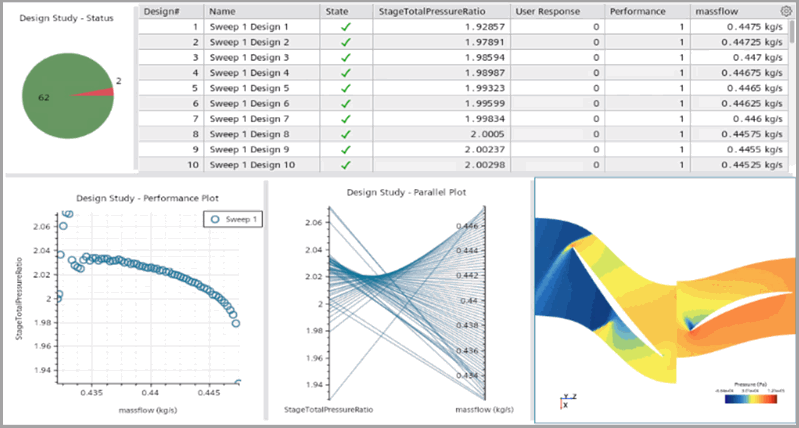
View the dashboard.

For this smart sweep study, the dashboard consists of:
- An output table with design details.
- A parallel plot of the response StageTotalPressureRatio against the input parameter massflow.
- A performance plot of the response StageTotalPressureRatio against the input parameter massflow.
- A pie chart plot of the design status— 68 successful runs and 2 designs with unfulfilled bisect criteria. It is designed in the stopping criteria of the smart sweep, the design study stops if the bisect value exceeds 1.
For each compressor, there is a designed stable operating range, where the
pressure increase is efficient for the desired mass flow. A performance plot is an
important plot for engineering design of the air compressor.
-
To maximum the view of the performance plot:

