Visualizing the Solution
Visualize the solution for the displacement and stress.
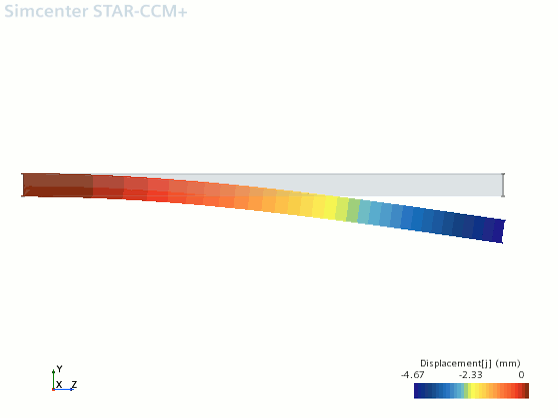
- Activate the Displacement scene in the Graphics window.
-
Click
 (Save-Restore-Select Views) and select
.

The computed maximum displacement is about 4.67 mm. Bernoulli-Euler beam theory predicts a displacement of about 4.63 mm, so the numerical solution differs from the theoretical result by less than 1%.
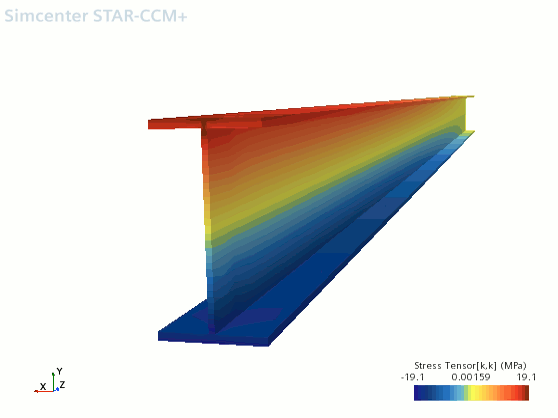
- Activate the Stress scene in the Graphics window.
-
Click
 (Save-Restore-Select Views) and select
.

As expected, the
Stress scene shows high stress concentrations at the extremities of the web, that was constrained in all degrees of freedom. Examine the stress at the top flange corner, which is sufficiently far from the constrained areas:
-
Right-click the
node and select
Run Report.
The report is printed to the output window. The computed stress at the top flange corner is about 17.4 MPa, which is in good agreement with the value of 17.3 MPa, given by Euler-Bernoulli beam theory.
To visualize how the stress computed near the fixed constraints deviates from Euler-Bernoulli beam theory:
-
Right-click the
node and select
Run Report.
The report is printed to the output window. The computed stress at the upper extremity of the web is about 18.61 MPa, which is higher than the result given by Euler-Bernoulli beam theory.
| Solution Method | Displacement [j] | at flange center | at flange corner |
|---|---|---|---|
| Euler-Bernoulli beam theory | - 4.63 mm | 17.34 MPa | 17.34 MPa |
Simcenter STAR-CCM+ analysis with:
|
- 4.67 mm | 18.61 MPa | 17.42 MPa |
Simcenter STAR-CCM+ analysis with:
|
-4.66 mm | 20.67 MPa | 24.08 MPa |