Plotting Data Using Line Probes
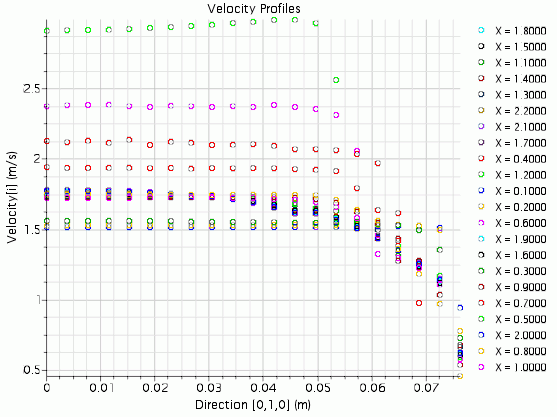
Use the line probes to create an X-Y plot of axial velocity profiles. Each data series presented on the plot corresponds to the data extracted along a single-line probe. The data contained in the plot are exported to a text file.
- Right-click the Plots node and select from the pop-up menu.
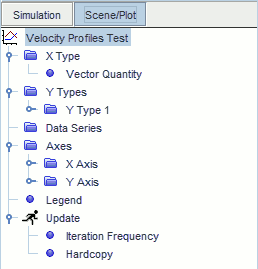
- Rename the node to Velocity Profiles.
-
Switch to the Scene/Plot pane by clicking the
Scene/Plot button above the object tree.

The X-axis of the plot shows the Y position data from the line probe, and the Y-axis of the plot shows the axial velocity at those Y positions. -
Edit the
Velocity Profiles node and set the following properties:
Node Property Setting Velocity Profiles Title Velocity Profiles 
Value [0.0, 1.0, 0.0] m 
Field Function  Legend
Position East Layout Vertical Font SIemens Sans Global Plain 8
The final operation is to set the
Parts property for the plot.
- Select the Velocity Profiles node at the top of the tree.
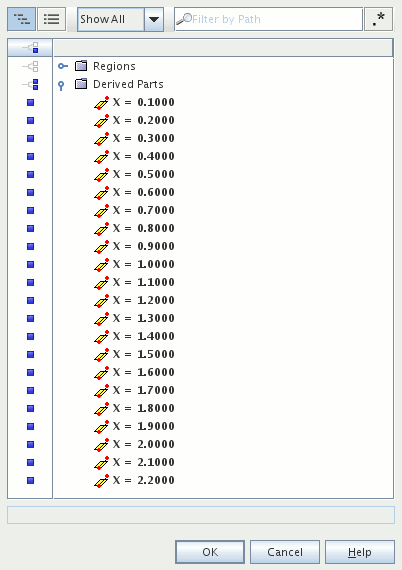
- In the Properties window, edit the Parts property.
- In the Velocity Profiles - Parts dialog, select the Derived Parts node.
-
Expand the node and make sure that all parts are selected.

- Click OK.
