Visualizing the Results
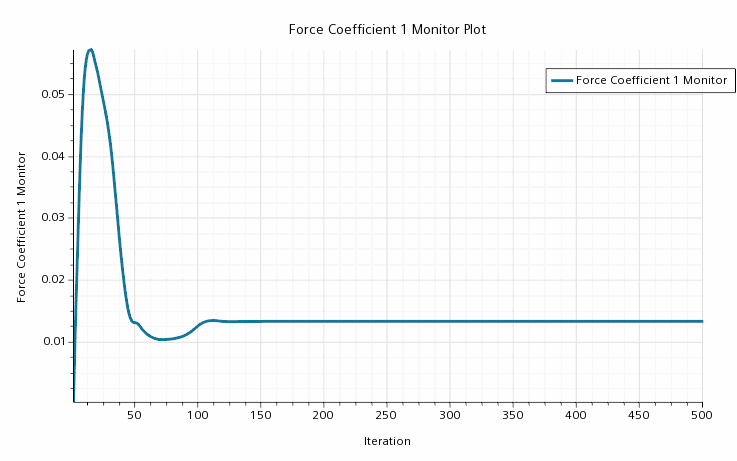
At the end of the calculation, the Residuals display show most of the residuals flattening out, which is a good indicator of convergence. The force coefficient plot also confirms this state. You can now review the results of the simulation using the scalar scene that you prepared earlier.
Once the solution is finished, you can examine the results.
-
Select the Force Coefficient 1 Monitor Plot display to
verify that the drag coefficient has flattened out.
To see the Mach number result for the finished solution:
-
Make the Scalar Scene 1 display active.
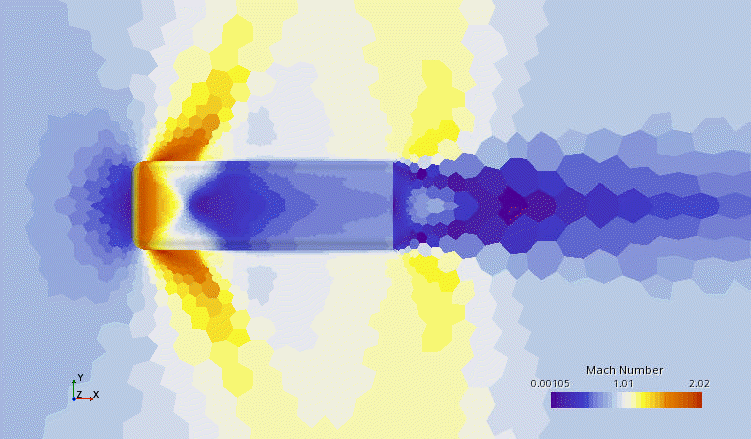
By default, the Automatic contour style is shown.
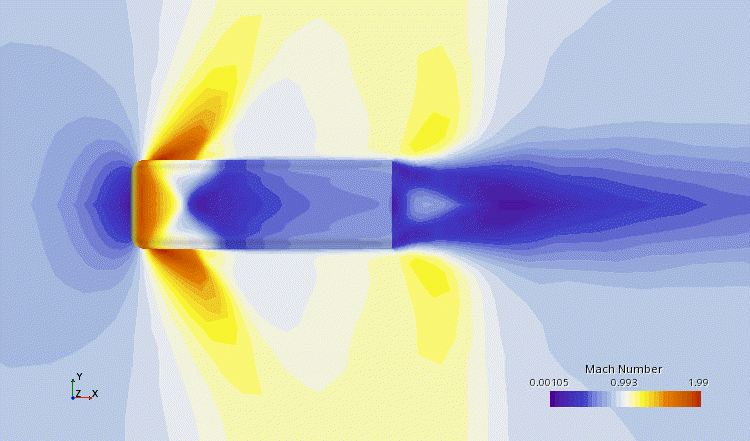
To display smooth contours:
-
Select the Scalar 1 node and set the Contour
Style to Smooth Filled.
The contours of the scalar display now appear smooth.
Display two scalar values at the same time: one on the symmetry plane, the other on the inner wall:
-
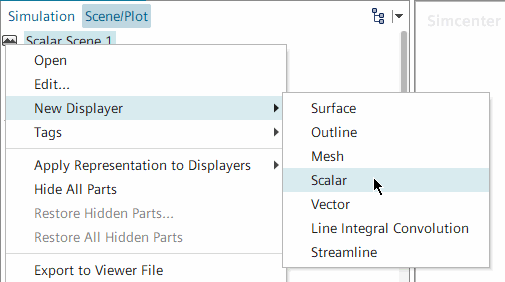
Add another scalar displayer by right-clicking the Scalar Scene
1 node and selecting .
-
In the display, right-click the scalar bar (blue) of the new displayer.

-
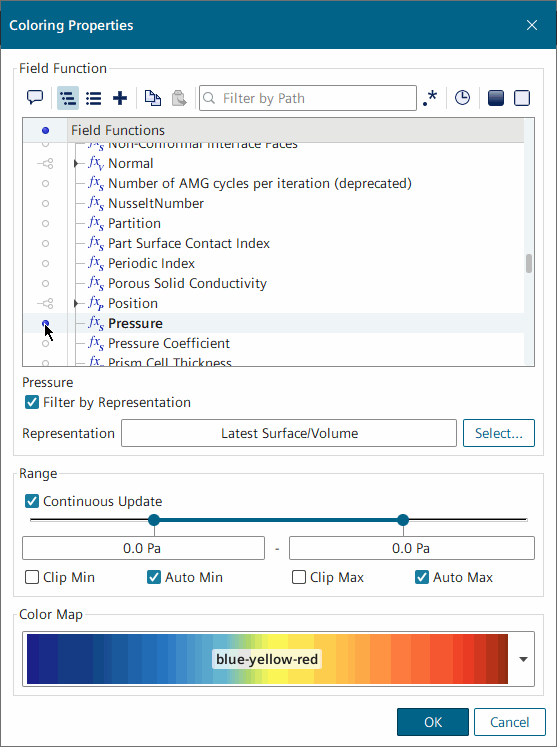
In the Coloring Properties dialog, select
Pressure.
-
Right-click the inner wall in the display, select Displayers and
among the checkboxes to the right:
- Deactivate the checkbox under Scalar 1.
- Activate the checkbox under Scalar 2.
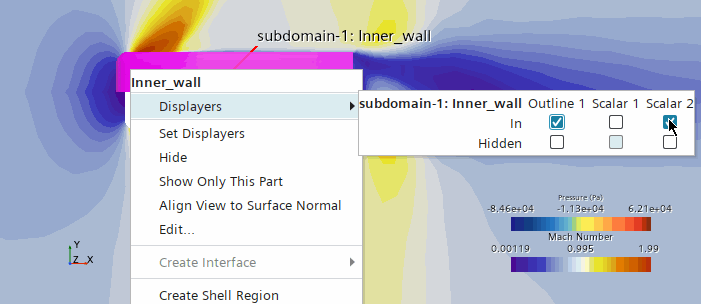
This single step transfers the part from one displayer to another.
- Select the node and set the Contour Style to Smooth Filled.
-
Activate the Account for Idealization
expert property.
The blunt body shows pressure values while the symmetry plane shows Mach number.

- Save the simulation.